Plot pairwise trait correlations with intervals
Source:R/plot-covariance-tables.R
plot_correlations.Rdplot_correlations() turns the tidy rows returned by
extract_correlations() into a horizontal forest plot, confidence-eye plot,
heatmap, or ellipse matrix. Forest and confidence-eye styles keep point
estimates visible as open points when interval bounds are missing, and draw
interval information only for rows with finite lower and upper bounds.
Matrix styles show the same tidy rows without requiring users to reconstruct
or hand-index a correlation matrix.
For fitted-object calls, open points can often be investigated by trying
method = "bootstrap" or another interval method supported by
extract_correlations().
Usage
plot_correlations(
  x,
  tier = "all",
  pair = NULL,
  level = 0.95,
  method = c("none", "fisher-z", "profile", "wald", "bootstrap"),
  n_eff = NULL,
  nsim = 500L,
  seed = NULL,
  link_residual = c("auto", "none"),
  facet = c("level", "none"),
  sort = c("estimate", "magnitude", "trait", "level"),
  show_intervals = NULL,
  style = c("interval", "eye", "raindrop", "heatmap", "ellipse", "oval"),
  eye_level = level,
  raindrop_level = NULL,
  triangle = c("full", "lower", "upper"),
  include_diagonal = TRUE,
  label = TRUE,
  label_type = c("auto", "estimate", "ci", "estimate_ci", "none"),
  label_digits = 2,
  matrix_layout = c("by_level", "estimate_ci", "levels"),
  title = NULL,
  subtitle = NULL,
  caption = NULL
)
Arguments
- x
Either a fit returned by
gllvmTMB(), abootstrap_Sigmaobject withR_B/R_Wsummaries, or a data frame returned byextract_correlations(). Data frames must containtier,trait_i,trait_j,correlation,lower,upper, andmethod. Matrix displays accept identical mirrored rows. Duplicate rows for the same pair and tier must agree in estimates, intervals and provenance; conflicting rows are rejected rather than selected by input order.- tier, pair, level, method, n_eff, nsim, seed, link_residual
Passed to
extract_correlations()whenxis a fitted model. Ignored whenxis already a data frame.- facet
One of
"level"(default) or"none". Facetting by level keeps repeated trait pairs readable when several tiers are present.- sort
Row ordering:
"estimate"(default),"magnitude","trait", or"level".- show_intervals
Logical or
NULL. IfNULL(default), finitelower/upperbounds are drawn as horizontal intervals forstyle = "interval"and omitted forstyle = "eye". SetTRUEto overlay interval lines on confidence eyes. Rows without finite bounds remain visible as points.- style
One of
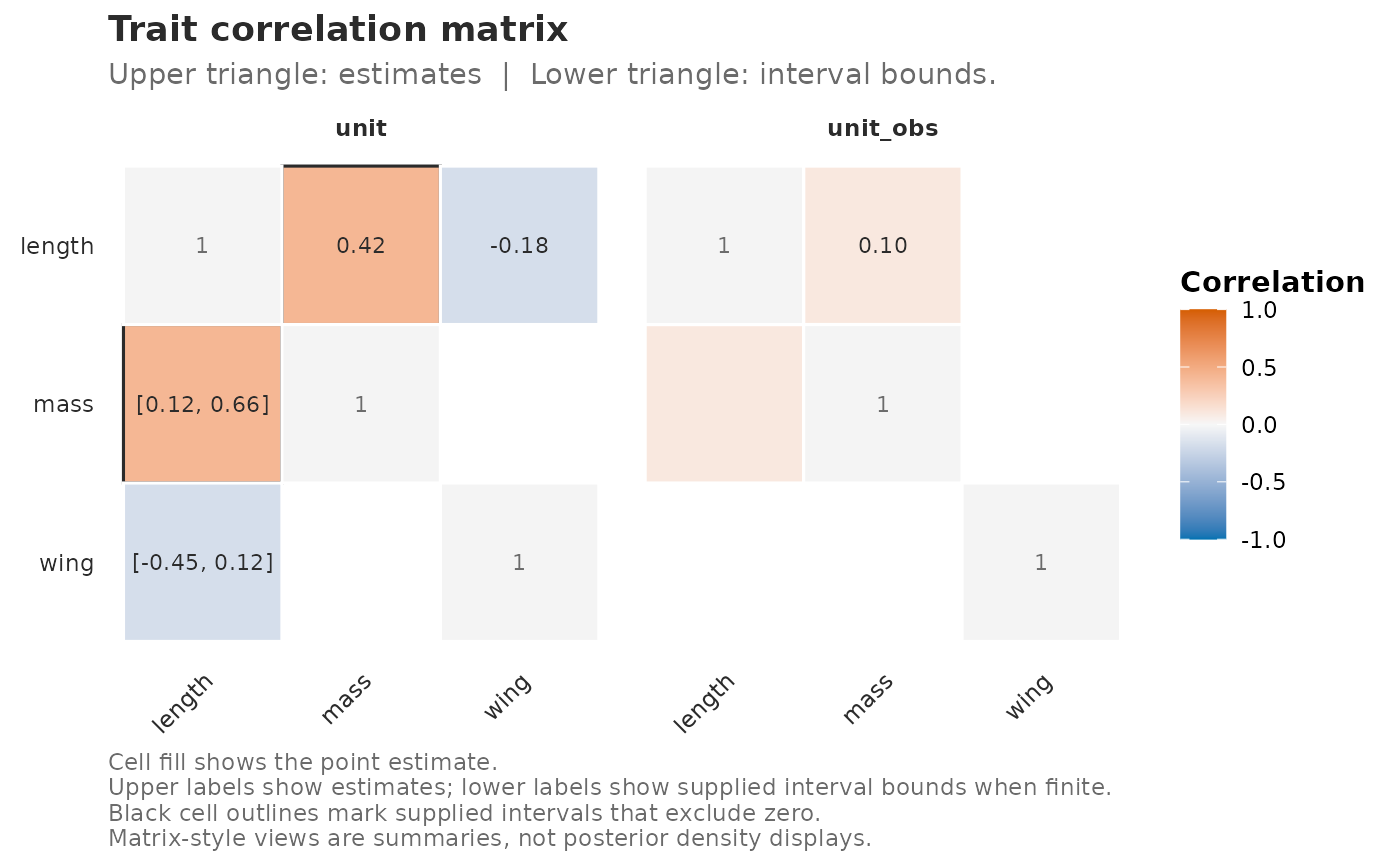
"interval"(default),"eye","raindrop","heatmap","ellipse", or"oval"."eye"draws a confidence eye: a pale frequentist compatibility shape reconstructed from the estimate and finite interval bounds, plus a hollow, sign-coloured estimate circle. Correlation rows use Fisher's z scale. The shape is not a posterior density."heatmap"draws a trait-by-trait matrix with colour showing the point estimate."ellipse"/"oval"draws correlation ellipses in matrix cells; ellipse tilt and width encode sign and strength."raindrop"is accepted as a compatibility alias for"eye", and"oval"as an alias for"ellipse".- eye_level
Confidence level represented by the supplied interval bounds when
style = "eye". Defaults tolevel, so fitted-object calls stay aligned withextract_correlations().- raindrop_level
Compatibility alias for
eye_level.- triangle
Matrix triangle to show for
style = "heatmap"orstyle = "ellipse"whenmatrix_layout = "by_level":"full"(default),"lower", or"upper".- include_diagonal
Logical. Include muted diagonal self-correlation cells in matrix styles?
- label
Logical. Print cell labels in matrix styles?
- label_type
For matrix styles, one of
"auto"(default),"estimate","ci","estimate_ci", or"none". Withmatrix_layout = "estimate_ci","auto"prints point estimates in the upper triangle and interval bounds in the lower triangle. Interval labels are printed only where finitelowerandupperbounds are supplied.- label_digits
Non-negative whole number of decimal places for matrix cell labels.
- matrix_layout
Matrix-cell layout for heatmap and ellipse styles.
"by_level"facets levels and usestriangledirectly."estimate_ci"uses the full matrix for each level: upper triangle labels point estimates and lower triangle labels supplied interval bounds."levels"combines exactly two levels into one full matrix: upper triangle shows the first level and lower triangle shows the second level.- title, subtitle, caption
Optional scalar character labels for matrix styles.
NULLkeeps publication-safe defaults.
Details
Julia bridge (engine = "julia") fits currently fail with an explicit gate
because this helper depends on interval-bearing extract_correlations()
rows. Use plot_Sigma_table() or plot_Sigma_heatmap() for point-only
Julia bridge correlation displays.
Scope: the helper plots tidy cross-trait correlation rows from
extract_correlations(), extracts those rows from a fit returned by
gllvmTMB() (this is covered by the package's extractor-contract
validation tests), or converts bootstrap_Sigma() correlation summaries to
the same plotting schema (also covered by those tests). Matrix heatmaps and
ellipse/oval displays, including upper-estimate/lower-CI and two-level
upper/lower layouts, are point-estimate summaries with optional numeric
interval labels (covered separately).
The plot does not compute new intervals; it displays whatever
interval method the input rows already contain. Matrix-style visual
comparisons against known truth remain article code rather than part of this
helper.
Examples
if (requireNamespace("ggplot2", quietly = TRUE)) {
  cors <- data.frame(
    tier = c("unit", "unit", "unit_obs"),
    trait_i = c("length", "length", "length"),
    trait_j = c("mass", "wing", "mass"),
    correlation = c(0.42, -0.18, 0.10),
    lower = c(0.12, -0.45, NA),
    upper = c(0.66, 0.12, NA),
    method = c("fisher-z", "fisher-z", "none")
  )
  plot_correlations(cors)
  plot_correlations(cors, style = "heatmap", matrix_layout = "estimate_ci")
}