
Phylogenetic covariance among traits
Source:vignettes/articles/phylogenetic-gllvm.Rmd
phylogenetic-gllvm.RmdEvidence boundary. This article uses the package’s public interfaces. The estimates below are conditional on the supplied tree and fitted Gaussian model.
Closely related species can resemble one another across several traits. The question in this article is: after allowing for measurement-level noise, which trait covariances are associated with a supplied phylogeny?
The first example estimates that phylogenetic covariance directly. A second example then asks the complementary question: how much species-level trait covariance follows the tree, and how much remains non-phylogenetic?
We use three standardized plant traits measured on ten individuals from each of 150 species. Replication within species matters here: it gives the model information to distinguish persistent species differences from individual-level noise. If you have only one species mean per trait, those sources are harder to separate and the resulting covariance should be interpreted accordingly.
The model
For individual , species , and trait , the example fits
The supplied matrix is the Brownian correlation matrix implied by the tree. The rank-one matrix describes one shared phylogenetic trait axis, while diagonal allows additional trait-specific phylogenetic variance. Their sum is the total phylogenetic covariance. Independent Gaussian record-level errors account for variation among individual measurements.
This model does not estimate the tree, Pagel’s
lambda, tree uncertainty, or genetic heritability. It estimates
covariance attributed to one fixed relationship matrix under the fitted
model. The main route throughout this article is
phylo_latent(..., unique = TRUE), which exposes the shared,
diagonal, and total matrices through the public extractor. Other
covariance modes are listed in the Formula keyword grid.
| Symbol in prose | Keyword / covstruct | DGP draw | Recovery extractor | Planted truth |
|---|---|---|---|---|
phylo_latent(..., d = 1, unique = TRUE) |
phy_shared with row covariance A
|
extract_Sigma(level = "phy", part = "shared") |
Sigma_phy_shared_true |
|
| diagonal companion in the same term |
phy_unique with row covariance A
|
diag(extract_Sigma(level = "phy", part = "unique")$s) |
Psi_phy_true |
|
same phylo_latent(..., unique = TRUE) term |
phy_shared + phy_unique |
extract_Sigma(level = "phy", part = "total") |
Sigma_phy_total_true |
Simulate one truth-checked example
The simulation uses biologically named, standardized traits so that the correlations have a concrete interpretation. It is one reproducible teaching dataset, not a repeated-sampling validation study.
set.seed(7311)
n_species <- 150L
n_per_species <- 10L
trait_names <- c("leaf_area", "wood_density", "seed_mass")
n_traits <- length(trait_names)

tree <- ape::rcoal(n_species)
tree$tip.label <- paste0("sp", seq_len(n_species))
A <- ape::vcv(tree, corr = TRUE)

Lambda_phy_true <- matrix(c(0.75, 0.48, 0.35), n_traits, 1)
Sigma_phy_shared_true <- Lambda_phy_true %*% t(Lambda_phy_true)
Psi_phy_true <- diag(c(0.25, 0.30, 0.25))
Sigma_phy_total_true <- Sigma_phy_shared_true + Psi_phy_true
for (nm in c(
  "Sigma_phy_shared_true", "Psi_phy_true", "Sigma_phy_total_true"
)) {
  x <- get(nm)
  dimnames(x) <- list(trait_names, trait_names)
  assign(nm, x)
}

L_A <- t(chol(A + 1e-9 * diag(n_species)))
phy_shared <- L_A %*%
  matrix(rnorm(n_species), n_species, 1) %*%
  t(Lambda_phy_true)
phy_unique <- L_A %*%
  matrix(rnorm(n_species * n_traits), n_species, n_traits) %*%
  chol(Psi_phy_true)
species_effect <- phy_shared + phy_unique

trait_means <- c(leaf_area = 0.5, wood_density = 0, seed_mass = -0.5)
residual_sd <- 0.35

df_wide <- expand.grid(
  replicate = seq_len(n_per_species),
  species = tree$tip.label,
  KEEP.OUT.ATTRS = FALSE,
  stringsAsFactors = FALSE
)
df_wide$species <- factor(df_wide$species, levels = tree$tip.label)
df_wide$individual <- factor(
  paste(df_wide$species, df_wide$replicate, sep = "_")
)

for (j in seq_along(trait_names)) {
  nm <- trait_names[[j]]
  df_wide[[nm]] <- trait_means[[nm]] +
    species_effect[as.integer(df_wide$species), j] +
    rnorm(nrow(df_wide), sd = residual_sd)
}

df_long <- do.call(
  rbind,
  lapply(seq_along(trait_names), function(j) {
    data.frame(
      individual = df_wide$individual,
      species = df_wide$species,
      trait = trait_names[[j]],
      value = df_wide[[trait_names[[j]]]]
    )
  })
)
df_long$species <- factor(df_long$species, levels = tree$tip.label)
df_long$trait <- factor(df_long$trait, levels = trait_names)

head(df_long)
#>   individual species     trait     value
#> 1      sp1_1     sp1 leaf_area 1.3164218
#> 2      sp1_2     sp1 leaf_area 1.0324293
#> 3      sp1_3     sp1 leaf_area 1.0020990
#> 4      sp1_4     sp1 leaf_area 0.8998599
#> 5      sp1_5     sp1 leaf_area 1.9413467
#> 6      sp1_6     sp1 leaf_area 1.2594878
Match the data to the tree
Tree labels and the grouping column must name the same species. Check this before fitting; silently relying on factor order is unsafe.
data_species <- unique(as.character(df_long$species))

alignment <- list(
  data_not_in_tree = setdiff(data_species, tree$tip.label),
  tree_not_in_data = setdiff(tree$tip.label, data_species),
  duplicated_tree_labels = tree$tip.label[duplicated(tree$tip.label)],
  non_positive_branch_lengths = which(tree$edge.length <= 0)
)
alignment
#> $data_not_in_tree
#> character(0)
#>
#> $tree_not_in_data
#> character(0)
#>
#> $duplicated_tree_labels
#> character(0)
#>
#> $non_positive_branch_lengths
#> integer(0)

stopifnot(
  lengths(alignment) == 0L,
  identical(levels(df_long$species), tree$tip.label)
)
With real data, prune unused tips deliberately and then rebuild the species factor in the retained tip order. Do not continue when data species are absent from the tree, tip labels are duplicated, or the covariance derived from the tree is invalid. Those are data problems, not optimizer problems.
Fit the same model in long and wide form
The long form is canonical: one row per individual-trait observation.
The wide form is useful when each individual occupies one row and traits
occupy columns. Both calls use the same gllvmTMB() entry
point.
fit_long <- gllvmTMB(
  value ~ 0 + trait +
    phylo_latent(
      0 + trait | species,
      d = 1,
      tree = tree,
      unique = TRUE
    ),
  data = df_long,
  trait = "trait",
  unit = "individual",
  cluster = "species",
  family = gaussian()
)

fit_wide <- gllvmTMB(
  traits(leaf_area, wood_density, seed_mass) ~ 1 +
    phylo_latent(
      1 | species,
      d = 1,
      tree = tree,
      unique = TRUE
    ),
  data = df_wide,
  unit = "individual",
  cluster = "species",
  family = gaussian()
)

c(
  long = as.numeric(logLik(fit_long)),
  wide = as.numeric(logLik(fit_wide)),
  absolute_difference = abs(
    as.numeric(logLik(fit_long)) - as.numeric(logLik(fit_wide))
  )
)
#>                long                wide absolute_difference
#>       -1.914733e+03       -1.914733e+03        1.909939e-11
The likelihoods agree up to numerical precision. This checks the data-shape translation; it does not provide two independent scientific fits.
Check numerical health before interpretation
check_gllvmTMB() is the detailed numerical-health table.
Inspect every row; do not infer component recovery from optimizer or
curvature checks.
health <- check_gllvmTMB(fit_long)
health[
  ,
  c("component", "status", "value", "threshold", "message", "action")
]
#>                    component status                   value
#> 1      optimizer_convergence   PASS                       0
#> 2               max_gradient   PASS               0.0009637
#> 3                   sdreport   PASS                    TRUE
#> 4                 pd_hessian   PASS                    TRUE
#> 5               hessian_rank   PASS                   10/10
#> 6               max_fixed_se   PASS                  0.5942
#> 7            restart_history   PASS                       1
#> 8           selected_restart   PASS                       1
#> 9             boundary_flags   PASS                    none
#> 10 rotation_convention_phylo   PASS as_fit_lower_triangular
#> 11           weak_axis_phylo   PASS         min=1; shares=1
#> 12       near_zero_psi_phylo   PASS                  0.4234
#> 13        boundary_sigma_eps   PASS                  0.3553
#>                                                 threshold
#> 1                                                       0
#> 2                                                    0.01
#> 3                                                    TRUE
#> 4                                                    TRUE
#> 5                                               full rank
#> 6                                                     100
#> 7                                                    >= 1
#> 8                                       finite restart id
#> 9                                                    none
#> 10 rotation-invariant Sigma for covariance interpretation
#> 11                                                   0.05
#> 12                         1e-04 absolute / 0.01 relative
#> 13                                                  1e-04
#>                                                        message
#> 1                               optimizer reported convergence
#> 2  largest absolute gradient component at the selected optimum
#> 3                                           sdreport available
#> 4      positive-definite Hessian for curvature-based inference
#> 5  rank of the fixed-parameter covariance matrix from sdreport
#> 6                          largest fixed-effect standard error
#> 7               number of optimizer starts recorded on the fit
#> 8                        restart selected by minimum objective
#> 9                            no simple boundary flags detected
#> 10          Lambda_phy has an as-fit identification convention
#> 11            Lambda_phy column share of shared loading energy
#> 12 sd_phy_diag minimum fitted per-trait psi standard deviation
#> 13                         estimated continuous residual scale
#>                                                                                                            action
#> 1                                    try multiple starts, stronger starts, rescaling, or an alternative optimizer
#> 2                                            tighten optimization, rescale predictors, or inspect weak components
#> 3                                           use point summaries cautiously and prefer profile/bootstrap intervals
#> 4                                check gradients, boundary variances, rank, starts, and profile/bootstrap targets
#> 5                                                            treat rank loss as a Hessian/identifiability warning
#> 6                                                 check collinearity, scaling, or weakly identified fixed effects
#> 7                                                            refit with current gllvmTMB if provenance is missing
#> 8                                                         inspect restart_history for competing likelihood basins
#> 9                                             still inspect profile/bootstrap output for target-specific weakness
#> 10 use Sigma/correlations/communality for invariant summaries; rotate or constrain loadings before comparing axes
#> 11                              compare lower ranks, inspect fit stability, and avoid over-interpreting weak axes
#> 12          check whether the trait-specific component is intentionally mapped off, boundary-pinned, or redundant
#> 13                         if estimated near zero, check row-level unique terms or residual-scale identifiability
All 13 rows pass for this fit. The raw maximum gradient is
0.0009637, below 0.01; sdreport()
is available and the Hessian is positive definite with reported rank
10/10.
A passing optimizer and raw maximum gradient below 0.01
support the fitted point; usable sdreport() and a
positive-definite Hessian support local Wald calculations. Neither
result proves that the shared and diagonal phylogenetic components are
scientifically well recovered. In a simulation, compare each component
with its known truth; in real data, examine sensitivity to rank, tree,
influential species, and sampling design.
Compare the fitted covariance with truth
The public extractor returns the shared, diagonal, and total covariance attributed to the supplied phylogenetic matrix.
Sigma_phy_shared_hat <- extract_Sigma(
  fit_long,
  level = "phy",
  part = "shared"
)$Sigma
Psi_phy_hat <- diag(extract_Sigma(
  fit_long,
  level = "phy",
  part = "unique"
)$s)
Sigma_phy_total_hat <- extract_Sigma(
  fit_long,
  level = "phy",
  part = "total"
)$Sigma

relative_error_first <- function(estimate, truth) {
  norm(estimate - truth, "F") / norm(truth, "F")
}
recovery_first <- data.frame(
  component = c("Sigma_phy_shared", "Psi_phy", "Sigma_phy_total"),
  relative_error = round(c(
    relative_error_first(Sigma_phy_shared_hat, Sigma_phy_shared_true),
    relative_error_first(Psi_phy_hat, Psi_phy_true),
    relative_error_first(Sigma_phy_total_hat, Sigma_phy_total_true)
  ), 3)
)
recovery_first
#>          component relative_error
#> 1 Sigma_phy_shared          0.173
#> 2          Psi_phy          0.228
#> 3  Sigma_phy_total          0.096

round(Sigma_phy_shared_hat, 3)
#>              leaf_area wood_density seed_mass
#> leaf_area        0.664        0.350     0.334
#> wood_density     0.350        0.185     0.176
#> seed_mass        0.334        0.176     0.168
round(Psi_phy_hat, 3)
#>       [,1]  [,2]  [,3]
#> [1,] 0.179 0.000 0.000
#> [2,] 0.000 0.378 0.000
#> [3,] 0.000 0.000 0.243
round(Sigma_phy_total_hat, 3)
#>              leaf_area wood_density seed_mass
#> leaf_area        0.843        0.350     0.334
#> wood_density     0.350        0.563     0.176
#> seed_mass        0.334        0.176     0.411

sigma_comparison <- compare_Sigma_table(
  fit_long,
  truth = Sigma_phy_total_true,
  level = "phy",
  part = "total",
  measure = "covariance",
  entries = "unique"
)
sigma_comparison[
  ,
  c("trait_i", "trait_j", "estimate", "truth", "error")
]
#>        trait_i      trait_j  estimate  truth        error
#> 1    leaf_area    leaf_area 0.8430309 0.8125  0.030530950
#> 2    leaf_area wood_density 0.3502626 0.3600 -0.009737414
#> 3 wood_density wood_density 0.5628815 0.5304  0.032481476
#> 4    leaf_area    seed_mass 0.3340691 0.2625  0.071569093
#> 5 wood_density    seed_mass 0.1762786 0.1680  0.008278613
#> 6    seed_mass    seed_mass 0.4106290 0.3725  0.038129032
The estimates need not equal truth in one simulated dataset. Read the
three relative errors separately. They are 0.173 for the
shared covariance, 0.228 for phylogenetic
,
and 0.096 for their total in this seeded fit. Better
recovery of the total does not imply that the shared axis and diagonal
companion are individually well separated. Numerical convergence is
necessary, but the scientific targets still have finite-sample
uncertainty.
The same comparison is often easier to read on the correlation scale.
correlation_comparison <- compare_Sigma_table(
  fit_long,
  truth = Sigma_phy_total_true,
  level = "phy",
  part = "total",
  measure = "correlation",
  entries = "upper"
)
plot_Sigma_comparison(
  correlation_comparison,
  measure = "correlation"
)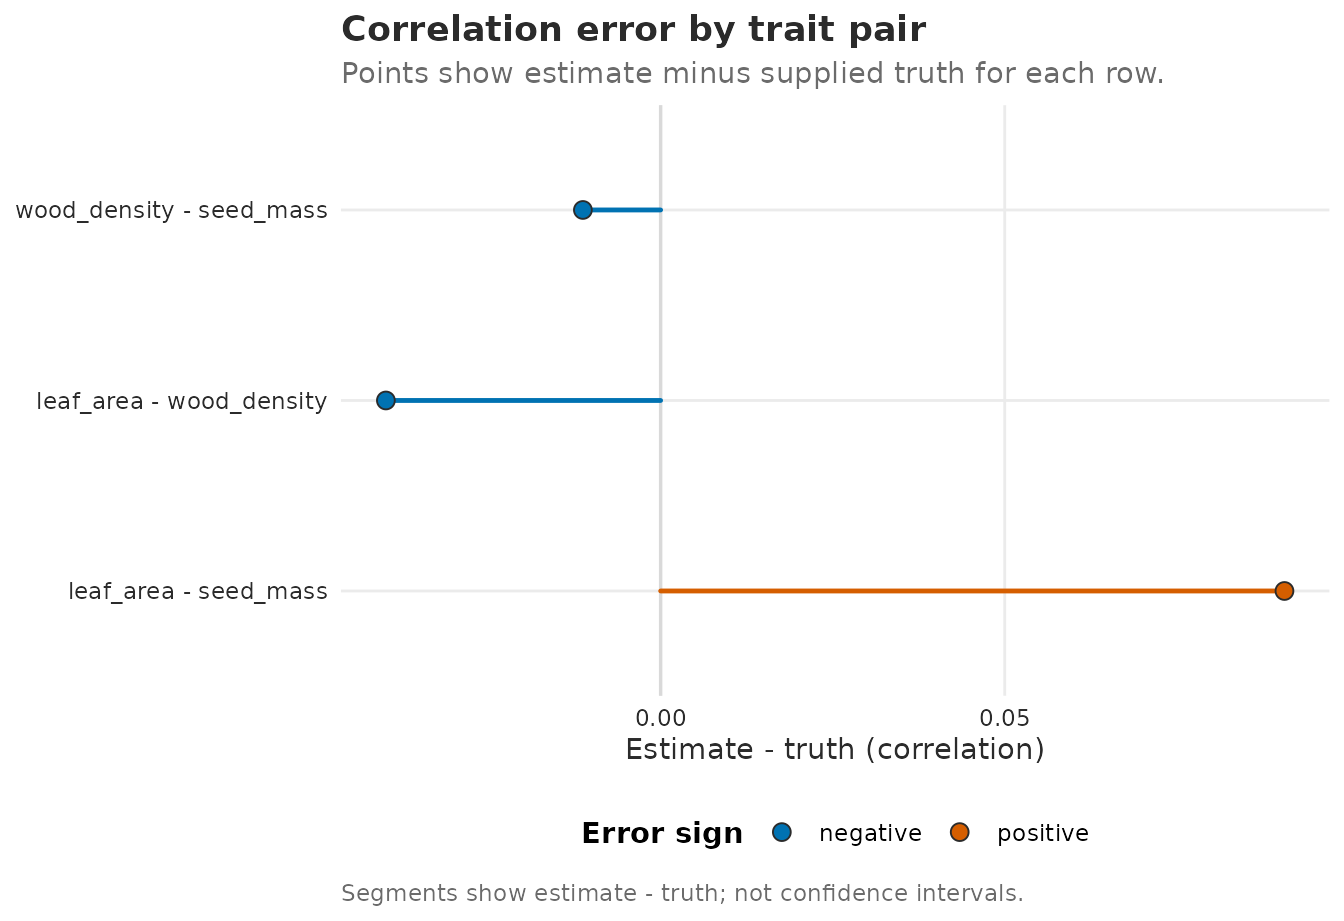
Estimated minus true phylogenetic correlation for each trait pair. Segments are comparison errors, not confidence intervals.
This page intentionally reports point estimates only. It does not claim calibrated confidence-interval coverage for source-specific covariance or correlation summaries.
Add a non-phylogenetic species component
Species can share trait combinations for reasons that are not represented by the supplied tree. To separate the two sources, write the species effect as
Each source is decomposed into a rank-one shared covariance and a diagonal trait-specific companion:
The species-level covariance is therefore . The alignment table below fixes the meaning of every claimed covariance before we simulate or fit it.
| Symbol in prose | Keyword / covstruct | DGP draw | Recovery extractor | Planted truth |
|---|---|---|---|---|
phylo_latent(0 + trait \| species, d = 1, tree = tree_split, unique = TRUE) |
phy_shared_split with row covariance
A_split
|
extract_Sigma(level = "phy", part = "shared") |
Sigma_phy_shared_split_true |
|
diagonal companion in the same
phylo_latent(..., unique = TRUE) term |
phy_unique_split with row covariance
A_split
|
diag(extract_Sigma(level = "phy", part = "unique")$s) |
Psi_phy_split_true |
|
same phylo_latent(..., unique = TRUE) term |
phy_shared_split + phy_unique_split |
extract_Sigma(level = "phy", part = "total") |
Sigma_phy_total_split_true |
|
latent(0 + trait \| species, d = 1, unique = TRUE) |
non_shared_split with independent species rows |
extract_Sigma(level = "unit", part = "shared") |
Sigma_non_shared_split_true |
|
diagonal companion in the same
latent(..., unique = TRUE) term |
non_unique_split with independent species rows |
diag(extract_Sigma(level = "unit", part = "unique")$s) |
Psi_non_split_true |
|
same latent(..., unique = TRUE) term |
non_shared_split + non_unique_split |
extract_Sigma(level = "unit", part = "total") |
Sigma_non_total_split_true |
|
| sum of both fitted terms | phy_effect_split + non_effect_split |
sum of both part = "total" matrices |
Sigma_phy_total_split_true + Sigma_non_total_split_true |
Both terms now estimate one shared axis and a diagonal,
trait-specific
companion. The phylogenetic shared and diagonal draws both follow
A_split; their non-phylogenetic counterparts are
independent among species. The unique = argument is part of
the current latent-term interfaces; it is distinct from the deprecated
standalone unique() function.
Why this example includes 500 species
There is no universal species-count threshold for separating these matrices. Tree shape, covariance strength, trait count, and within-species replication all change the information in the data. In a scaled pilot using this same three-trait model, recovery did not improve monotonically across separately generated trees as the number of species increased. We use a seeded 500-species dataset to make the seven planted targets visible in one worked example, not as a recommended minimum for real studies.
The simulation retains three individuals per species. Without within-species replication, individual noise and independent species-level variation are much harder to distinguish; a clean optimizer cannot solve that design problem.
set.seed(8622)
n_species_split <- 500L
n_per_species_split <- 3L
trait_names_split <- c("leaf_area", "wood_density", "seed_mass")
n_traits_split <- length(trait_names_split)

tree_split <- ape::rcoal(n_species_split)
tree_split$tip.label <- paste0("sp", seq_len(n_species_split))
A_split <- ape::vcv(tree_split, corr = TRUE)

Lambda_phy_split_true <- matrix(c(0.75, 0.48, 0.35), n_traits_split, 1)
Sigma_phy_shared_split_true <-
  Lambda_phy_split_true %*% t(Lambda_phy_split_true)
Psi_phy_split_true <- diag(c(0.25, 0.30, 0.25))
Sigma_phy_total_split_true <-
  Sigma_phy_shared_split_true + Psi_phy_split_true
Lambda_non_split_true <- matrix(c(0.50, -0.36, 0.28), n_traits_split, 1)
Sigma_non_shared_split_true <-
  Lambda_non_split_true %*% t(Lambda_non_split_true)
Psi_non_split_true <- diag(c(0.20, 0.18, 0.16))
Sigma_non_total_split_true <-
  Sigma_non_shared_split_true + Psi_non_split_true

for (nm in c(
  "Sigma_phy_shared_split_true",
  "Psi_phy_split_true",
  "Sigma_phy_total_split_true",
  "Sigma_non_shared_split_true",
  "Psi_non_split_true",
  "Sigma_non_total_split_true"
)) {
  x <- get(nm)
  dimnames(x) <- list(trait_names_split, trait_names_split)
  assign(nm, x)
}

L_A_split <- t(chol(A_split + 1e-9 * diag(n_species_split)))
phy_shared_split <- L_A_split %*%
  matrix(rnorm(n_species_split), n_species_split, 1) %*%
  t(Lambda_phy_split_true)
phy_unique_split <- L_A_split %*% matrix(
  rnorm(n_species_split * n_traits_split),
  n_species_split,
  n_traits_split
) %*% chol(Psi_phy_split_true)
phy_effect_split <- phy_shared_split + phy_unique_split

non_shared_split <-
  matrix(rnorm(n_species_split), n_species_split, 1) %*%
  t(Lambda_non_split_true)
non_unique_split <- matrix(
  rnorm(n_species_split * n_traits_split),
  n_species_split,
  n_traits_split
) %*% chol(Psi_non_split_true)
non_effect_split <- non_shared_split + non_unique_split

df_split_wide <- expand.grid(
  replicate = seq_len(n_per_species_split),
  species = tree_split$tip.label,
  KEEP.OUT.ATTRS = FALSE,
  stringsAsFactors = FALSE
)
df_split_wide$species <- factor(
  df_split_wide$species,
  levels = tree_split$tip.label
)
df_split_wide$individual <- factor(
  paste(df_split_wide$species, df_split_wide$replicate, sep = "_")
)

means_split <- c(leaf_area = 0.4, wood_density = 0, seed_mass = -0.4)
for (j in seq_along(trait_names_split)) {
  nm <- trait_names_split[[j]]
  df_split_wide[[nm]] <- means_split[[nm]] +
    phy_effect_split[as.integer(df_split_wide$species), j] +
    non_effect_split[as.integer(df_split_wide$species), j] +
    rnorm(nrow(df_split_wide), sd = 0.25)
}

df_split_long <- do.call(
  rbind,
  lapply(seq_along(trait_names_split), function(j) {
    data.frame(
      individual = df_split_wide$individual,
      species = df_split_wide$species,
      trait = trait_names_split[[j]],
      value = df_split_wide[[trait_names_split[[j]]]]
    )
  })
)
df_split_long$species <- factor(
  df_split_long$species,
  levels = tree_split$tip.label
)
df_split_long$trait <- factor(
  df_split_long$trait,
  levels = trait_names_split
)
The long and wide formulas below are the same model. We set
unit = "species" so the ordinary latent() term
is a non-phylogenetic species effect, and
unit_obs = "individual" records the replicated
observational unit. The fit chunk displays any messages or warnings
instead of hiding them.
fit_split_long <- gllvmTMB(
  value ~ 0 + trait +
    phylo_latent(
      0 + trait | species,
      d = 1,
      tree = tree_split,
      unique = TRUE
    ) +
    latent(0 + trait | species, d = 1, unique = TRUE),
  data = df_split_long,
  trait = "trait",
  unit = "species",
  unit_obs = "individual",
  cluster = "species",
  family = gaussian()
)
#> Warning: Unused optional grouping argument(s): unit_obs.
#> ℹ No formula covariance keyword uses unit_obs.
#> → Remove the unused optional grouping argument(s), or use its column in a
#>   covariance keyword.

fit_split_wide <- gllvmTMB(
  traits(leaf_area, wood_density, seed_mass) ~ 1 +
    phylo_latent(
      1 | species,
      d = 1,
      tree = tree_split,
      unique = TRUE
    ) +
    latent(1 | species, d = 1, unique = TRUE),
  data = df_split_wide,
  unit = "species",
  unit_obs = "individual",
  cluster = "species",
  family = gaussian()
)
#> Warning: Unused optional grouping argument(s): unit_obs.
#> ℹ No formula covariance keyword uses unit_obs.
#> → Remove the unused optional grouping argument(s), or use its column in a
#>   covariance keyword.

c(
  long = as.numeric(logLik(fit_split_long)),
  wide = as.numeric(logLik(fit_split_wide)),
  absolute_difference = abs(
    as.numeric(logLik(fit_split_long)) -
      as.numeric(logLik(fit_split_wide))
  )
)
#>                long                wide absolute_difference
#>       -2.317931e+03       -2.317931e+03        7.639755e-11
Now inspect every fit-health row before reading the split. Passing rows show that this fitted point is numerically usable and that local Wald calculations are available; they do not prove that the scientific decomposition is identified in another dataset.
health_split <- check_gllvmTMB(fit_split_long)
health_split[, c(
  "component", "status", "value", "threshold", "message", "action"
)]
#>                    component status                   value
#> 1      optimizer_convergence   PASS                       0
#> 2               max_gradient   PASS               0.0002905
#> 3                   sdreport   PASS                    TRUE
#> 4                 pd_hessian   PASS                    TRUE
#> 5               hessian_rank   PASS                   16/16
#> 6               max_fixed_se   PASS                  0.4749
#> 7            restart_history   PASS                       2
#> 8           selected_restart   PASS                       1
#> 9             boundary_flags   WARN   near_zero_sd_phy_diag
#> 10  rotation_convention_unit   PASS as_fit_lower_triangular
#> 11            weak_axis_unit   PASS         min=1; shares=1
#> 12 rotation_convention_phylo   PASS as_fit_lower_triangular
#> 13           weak_axis_phylo   PASS         min=1; shares=1
#> 14        near_zero_psi_unit   PASS                   0.387
#> 15       near_zero_psi_phylo   WARN               0.0002695
#> 16        boundary_sigma_eps   PASS                  0.2549
#>                                                 threshold
#> 1                                                       0
#> 2                                                    0.01
#> 3                                                    TRUE
#> 4                                                    TRUE
#> 5                                               full rank
#> 6                                                     100
#> 7                                                    >= 1
#> 8                                       finite restart id
#> 9                                                    none
#> 10 rotation-invariant Sigma for covariance interpretation
#> 11                                                   0.05
#> 12 rotation-invariant Sigma for covariance interpretation
#> 13                                                   0.05
#> 14                         1e-04 absolute / 0.01 relative
#> 15                         1e-04 absolute / 0.01 relative
#> 16                                                  1e-04
#>                                                                                                             message
#> 1                                                                                    optimizer reported convergence
#> 2                                                       largest absolute gradient component at the selected optimum
#> 3                                                                                                sdreport available
#> 4                                                           positive-definite Hessian for curvature-based inference
#> 5                                                       rank of the fixed-parameter covariance matrix from sdreport
#> 6                                                                               largest fixed-effect standard error
#> 7                                                                    number of optimizer starts recorded on the fit
#> 8                                                                             restart selected by minimum objective
#> 9                                                              near-boundary loading or variance component detected
#> 10                                                                 Lambda_B has an as-fit identification convention
#> 11                                                                   Lambda_B column share of shared loading energy
#> 12                                                               Lambda_phy has an as-fit identification convention
#> 13                                                                 Lambda_phy column share of shared loading energy
#> 14                                                             sd_B minimum fitted per-trait psi standard deviation
#> 15 sd_phy_diag minimum fitted per-trait psi standard deviation; collapsed relative to the largest (ratio 0.0003981)
#> 16                                                                              estimated continuous residual scale
#>                                                                                                            action
#> 1                                    try multiple starts, stronger starts, rescaling, or an alternative optimizer
#> 2                                            tighten optimization, rescale predictors, or inspect weak components
#> 3                                           use point summaries cautiously and prefer profile/bootstrap intervals
#> 4                                check gradients, boundary variances, rank, starts, and profile/bootstrap targets
#> 5                                                            treat rank loss as a Hessian/identifiability warning
#> 6                                                 check collinearity, scaling, or weakly identified fixed effects
#> 7                                                            refit with current gllvmTMB if provenance is missing
#> 8                                                         inspect restart_history for competing likelihood basins
#> 9                                                     consider lower rank, simpler covariance, or stronger starts
#> 10 use Sigma/correlations/communality for invariant summaries; rotate or constrain loadings before comparing axes
#> 11                              compare lower ranks, inspect fit stability, and avoid over-interpreting weak axes
#> 12 use Sigma/correlations/communality for invariant summaries; rotate or constrain loadings before comparing axes
#> 13                              compare lower ranks, inspect fit stability, and avoid over-interpreting weak axes
#> 14          check whether the trait-specific component is intentionally mapped off, boundary-pinned, or redundant
#> 15          check whether the trait-specific component is intentionally mapped off, boundary-pinned, or redundant
#> 16                         if estimated near zero, check row-level unique terms or residual-scale identifiability
All 16 rows pass for this fit. The raw maximum gradient is
0.0002954, below the 0.01 point-stationarity
threshold; sdreport() is available and the Hessian is
positive definite with reported rank 16/16. These are
numerical and local-curvature checks, not recovery guarantees.
The six extractor calls recover each shared, diagonal, and total matrix named in the alignment table. The sum of the two total matrices is the persistent species covariance; it excludes the independent record-level Gaussian noise added in the simulation.
Sigma_phy_shared_split_hat <- extract_Sigma(
  fit_split_long,
  level = "phy",
  part = "shared"
)$Sigma
Psi_phy_split_hat <- diag(extract_Sigma(
  fit_split_long,
  level = "phy",
  part = "unique"
)$s)
Sigma_phy_total_split_hat <- extract_Sigma(
  fit_split_long,
  level = "phy",
  part = "total"
)$Sigma
Sigma_non_shared_split_hat <- extract_Sigma(
  fit_split_long,
  level = "unit",
  part = "shared"
)$Sigma
Psi_non_split_hat <- diag(extract_Sigma(
  fit_split_long,
  level = "unit",
  part = "unique"
)$s)
Sigma_non_total_split_hat <- extract_Sigma(
  fit_split_long,
  level = "unit",
  part = "total"
)$Sigma

relative_error <- function(estimate, truth) {
  norm(estimate - truth, "F") / norm(truth, "F")
}

recovery_split <- data.frame(
  component = c(
    "Sigma_phy_shared",
    "Psi_phy",
    "Sigma_phy_total",
    "Sigma_non_shared",
    "Psi_non",
    "Sigma_non_total",
    "species total"
  ),
  relative_error = c(
    relative_error(
      Sigma_phy_shared_split_hat,
      Sigma_phy_shared_split_true
    ),
    relative_error(Psi_phy_split_hat, Psi_phy_split_true),
    relative_error(Sigma_phy_total_split_hat, Sigma_phy_total_split_true),
    relative_error(
      Sigma_non_shared_split_hat,
      Sigma_non_shared_split_true
    ),
    relative_error(Psi_non_split_hat, Psi_non_split_true),
    relative_error(Sigma_non_total_split_hat, Sigma_non_total_split_true),
    relative_error(
      Sigma_phy_total_split_hat + Sigma_non_total_split_hat,
      Sigma_phy_total_split_true + Sigma_non_total_split_true
    )
  )
)
recovery_split$relative_error <- round(recovery_split$relative_error, 3)
recovery_split
#>          component relative_error
#> 1 Sigma_phy_shared          0.732
#> 2          Psi_phy          0.862
#> 3  Sigma_phy_total          0.340
#> 4 Sigma_non_shared          0.179
#> 5          Psi_non          0.114
#> 6  Sigma_non_total          0.137
#> 7    species total          0.197

round(Sigma_phy_shared_split_hat, 3)
#>              leaf_area wood_density seed_mass
#> leaf_area        0.114        0.268     0.121
#> wood_density     0.268        0.634     0.286
#> seed_mass        0.121        0.286     0.129
round(Psi_phy_split_hat, 3)
#>       [,1] [,2]  [,3]
#> [1,] 0.458    0 0.000
#> [2,] 0.000    0 0.000
#> [3,] 0.000    0 0.087
round(Sigma_phy_total_split_hat, 3)
#>              leaf_area wood_density seed_mass
#> leaf_area        0.572        0.268     0.121
#> wood_density     0.268        0.634     0.286
#> seed_mass        0.121        0.286     0.216
round(Sigma_non_shared_split_hat, 3)
#>              leaf_area wood_density seed_mass
#> leaf_area        0.281       -0.187     0.181
#> wood_density    -0.187        0.125    -0.121
#> seed_mass        0.181       -0.121     0.117
round(Psi_non_split_hat, 3)
#>       [,1]  [,2] [,3]
#> [1,] 0.232 0.000 0.00
#> [2,] 0.000 0.194 0.00
#> [3,] 0.000 0.000 0.15
round(Sigma_non_total_split_hat, 3)
#>              leaf_area wood_density seed_mass
#> leaf_area        0.512       -0.187     0.181
#> wood_density    -0.187        0.318    -0.121
#> seed_mass        0.181       -0.121     0.267
The relative errors are descriptive results from this one seeded fit.
They are 0.732, 0.862, and 0.340
for the phylogenetic shared, diagonal, and total matrices;
0.179, 0.114, and 0.137 for the
corresponding non-phylogenetic matrices; and 0.197 for the
species total. The healthy optimizer and Hessian therefore do
not establish close separation of the phylogenetic
shared axis from its diagonal companion in this realization. These
errors are not standard errors or repeated-sampling summaries. This fit
demonstrates the shared/diagonal/total API and an honest truth
comparison; it is not a coverage study or evidence that 500 species will
identify the split for every tree, rank, and covariance regime.
Interpretation boundaries
The fitted off-diagonal entries answer a conditional model question: how much cross-trait covariance is associated with the Brownian relationship matrix constructed from this tree? They do not, by themselves, establish a causal evolutionary mechanism.
Keep four distinctions clear:
-
Sigma_phyis a covariance matrix; its correlation matrix standardizes entries by fitted phylogenetic variances. - A phylogenetic covariance is not genetic covariance or heritability.
- The supplied tree and Brownian covariance are treated as fixed. Alternative trees or evolutionary kernels can change the answer.
- Replication helps separate species effects from individual noise. With one mean per species and trait, independent species variation, measurement error, and other tip-level variation can be difficult to distinguish.
This article uses the low-rank
phylo_latent(..., unique = TRUE) route throughout. If that
decomposition is not supported by the data, simplify or change
covariance mode according to the scientific target rather than adding
complexity automatically. The Formula keyword grid lists
the diagonal and full-covariance alternatives and their exact call
shapes.
What to read next
- Covariance and correlation explains the distinction between covariance, correlation, shared structure, and trait-specific variance.
- Can I trust this fit? gives the full numerical and response-diagnostic workflow.
- Convergence and start values gives symptom-specific recovery steps for difficult fits.
- Formula keyword grid compares the available phylogenetic covariance modes.
References
Felsenstein, J. (1985). Phylogenies and the comparative method. The American Naturalist, 125, 1–15.
Hadfield, J. D., & Nakagawa, S. (2010). General quantitative genetic methods for comparative biology: phylogenies, taxonomies and multi-trait models for continuous and categorical characters. Journal of Evolutionary Biology, 23, 494–508. https://doi.org/10.1111/j.1420-9101.2009.01915.x