
Covariance and correlation: the model behind Sigma
Source:vignettes/articles/covariance-correlation.Rmd
covariance-correlation.RmdThis page is for the reader who has fitted a multivariate model and now asks: which traits vary together, and are the reported correlations too large if the model leaves out trait-specific variance?
The covariance, correlation, and communality extractors described here are part of the package’s experimental surface, and their interval machinery is still maturing.
Start from the model, not from the covariance matrix. For a Gaussian
stacked-trait GLLVM, the teaching model for individual i
and trait t is
The model has three moving parts. mu_t is the trait
mean, u_i is the individual’s latent position on the shared
axes, and psi_tt is trait-specific variance left over after
those shared axes are fitted. Sigma is not the model
itself; it is the trait covariance implied by that model.
The shared axes are identified only up to an orthogonal rotation and sign flip, so the individual loadings are not uniquely defined. is rotation-invariant, but that property alone does not establish a unique split between shared and diagonal variance. Report the total for covariance and correlation targets; interpret shared components and communality as a chosen decomposition.
In ordinary latent() fits, gllvmTMB estimates both the
shared loading part and the diagonal Psi part by default. Use
latent(..., unique = FALSE) only when you deliberately want
the older loadings-only subset for a sensitivity check or compatibility
comparison.
This article is about Psi in a decomposed
latent() model. It is not a recommendation to use a
standalone diagonal term as the first model. When the goal is a
standalone marginal-only diagonal covariance, new examples should use
indep() so the intent is visible in the formula.
fit_no_residual <- gllvmTMB(
  value ~ 0 + trait +
    latent(0 + trait | individual, d = 2, unique = FALSE),
  data = df, trait = "trait", unit = "individual"
)

fit_latent_default <- gllvmTMB(
  value ~ 0 + trait + latent(0 + trait | individual, d = 2),
  data = df, trait = "trait", unit = "individual"
)
If your data are wide, with one row per individual and one column per
behaviour, use the same gllvmTMB() entry point with
traits(...) on the left-hand side:
fit_latent_default <- gllvmTMB(
  traits(boldness, exploration, activity, aggression, sociability) ~
    1 + latent(1 | individual, d = 2),
  data = df_wide, unit = "individual"
)
fit_no_residual_wide <- gllvmTMB(
  traits(boldness, exploration, activity, aggression, sociability) ~
    1 + latent(1 | individual, d = 2, unique = FALSE),
  data = df_wide, unit = "individual"
)
These are unevaluated structural translations only; the worked
long/wide comparison below evaluates the ordinary latent()
model and does not establish parity for the no-residual subset.
From model to Sigma
The fitted model above implies a covariance matrix for any covariance
tier you extract. For the ordinary latent() model, the
implied trait covariance is
Here level names the covariance tier being extracted:
unit for between-individual covariance,
unit_obs for within-individual or observation-level
covariance, and other tier names for structured terms.
is the
loading matrix from the latent() term.
is the
diagonal matrix of trait-specific variances.
The correlation matrix is a standardised version of
Sigma:
Both pieces matter. The diagonal of is — the sum of squared loadings plus the trait-specific diagonal variance — while the off-diagonals depend only on . The correlation divides those off-diagonals by the diagonal scale, so whether is present in the diagonal sets the scale of every reported correlation.
Read the model beside the R syntax and the report-ready summary:
| Object | R syntax or extractor | What the reader should report |
|---|---|---|
| Gaussian model | value ~ 0 + trait + latent(0 + trait | individual, d = 2) |
A reduced-rank multivariate model for the observed traits. |
level |
level = "unit" or level = "unit_obs"
|
Which covariance tier the summary belongs to. |
latent(..., d = K) |
Shared axes: traits that rise and fall together across units. | |
extract_Sigma_table(fit, level = "unit", part = "shared") |
Shared covariance explained by the latent variables only. | |
| and | default latent() Psi;
extract_Sigma_table(fit, level = "unit", part = "unique")
|
Trait-specific variance that keeps correlation denominators honest. |
extract_Sigma_table(fit, level = "unit", part = "total") |
Full trait covariance: shared structure plus trait-specific variance. | |
extract_correlations(fit, tier = "unit") or
$R from extract_Sigma()
|
The correlation matrix after standardising full . |
A side-by-side demonstration
We use a prepared Gaussian behavioural-syndrome example object shipped with the package. Its generating code is available in the source repository for reproducibility, but the article starts with the model rather than a long data-generating block.
The truth has both a shared low-rank component and a trait-specific diagonal Psi component. Fit the same data two ways:
-
Model A:latent(0 + trait | individual, d = 2, unique = FALSE)(no Psi) -
Model B:latent(0 + trait | individual, d = 2)(default Psi)
covex <- readRDS(system.file(
  "extdata", "examples", "covariance-edge-cases-example.rds",
  package = "gllvmTMB"
))
df <- covex$data_long
df_wide <- covex$data_wide
truth <- covex$truth
covex$story$question
#> [1] "Do five behaviours share latent syndrome axes while keeping behaviour-specific variance in the correlation denominator?"
head(df, 6)
#>   individual       trait       value
#> 1          1    boldness  0.12828192
#> 2          1 exploration -0.03210224
#> 3          1    activity -0.56732317
#> 4          1  aggression -0.65759306
#> 5          1 sociability -0.35474482
#> 6          2    boldness -0.93719645
The long-format formulas are:
covex$edge_cases$latent_only$formula_long
#> value ~ 0 + trait + latent(0 + trait | individual, d = 2, residual = FALSE)

# The stored formula printed above spells the switch as `residual = FALSE`,
# which is the soft-deprecated alias. `unique = FALSE` is the current spelling
# and is what the explicit forms below use.
#
# Model A is loadings-only (Psi switched off); Model B is the ordinary default
# (latent() carries the per-trait Psi). Written explicitly so the contrast is
# unambiguous under the 0.2.0 grammar where latent() carries Psi by default.
form_A <- value ~ 0 + trait + latent(0 + trait | individual, d = 2, unique = FALSE)
form_B <- value ~ 0 + trait + latent(0 + trait | individual, d = 2)
form_A
#> value ~ 0 + trait + latent(0 + trait | individual, d = 2, unique = FALSE)
form_B
#> value ~ 0 + trait + latent(0 + trait | individual, d = 2)
The wide data-frame formula expresses the same recommended model
through the traits(...) left-hand side:
form_B_wide <- traits(boldness, exploration, activity, aggression, sociability) ~
  1 + latent(1 | individual, d = 2)
form_B_wide
#> traits(boldness, exploration, activity, aggression, sociability) ~
#>     1 + latent(1 | individual, d = 2)
ctl <- gllvmTMBcontrol(se = FALSE)

fit_A <- gllvmTMB(
  form_A,
  data = df,
  trait = covex$fit_args$trait,
  unit = covex$fit_args$unit,
  family = covex$fit_args$family,
  control = ctl
)

fit_B <- gllvmTMB(
  form_B,
  data = df,
  trait = covex$fit_args$trait,
  unit = covex$fit_args$unit,
  family = covex$fit_args$family,
  control = ctl
)

fit_B_wide <- gllvmTMB(
  form_B_wide,
  data = df_wide,
  unit = covex$fit_args$unit,
  family = covex$fit_args$family,
  control = ctl
)
Long and wide fits use different data shapes, but here they represent the same likelihood:
c(
  long = as.numeric(logLik(fit_B)),
  wide = as.numeric(logLik(fit_B_wide))
)
#>      long      wide
#> -1111.151 -1111.151
Now extract the implied and between-individual correlation matrix from each fit:
ext_A <- suppressMessages(
  extract_Sigma(fit_A, level = "unit", part = "total")
)
ext_B <- extract_Sigma(fit_B, level = "unit", part = "total")
Notice that the call on fit_A emits a one-shot
advisory explaining that unique = FALSE
returns
without Psi (we suppressed the message above for clean output but the
message is also stored in ext_A$note).
ext_A$note  # advisory: diagonal Psi omitted by unique = FALSE
#> [1] "Sigma_unit is latent-only (Lambda Lambda^T): this fit used `latent(..., unique = FALSE)`, so trait-specific residual variance Psi is not modelled and correlations from this matrix overstate cross-trait coupling. For the full decomposition Sigma = Lambda Lambda^T + Psi, refit without `unique = FALSE` (the default)."
The correlations side by side
cmp_A <- compare_Sigma_table(
  fit_A,
  truth = Sigma_true,
  level = "unit",
  measure = "correlation",
  entries = "upper"
)
cmp_A$comparison <- "Model A: no-residual latent"

cmp_B <- compare_Sigma_table(
  fit_B,
  truth = Sigma_true,
  level = "unit",
  measure = "correlation",
  entries = "upper"
)
cmp_B$comparison <- "Model B: ordinary latent with Psi"

corr_comparison <- rbind(cmp_A, cmp_B)
plot_Sigma_comparison(
  corr_comparison,
  measure = "correlation",
  facet = "comparison",
  sort = "trait"
)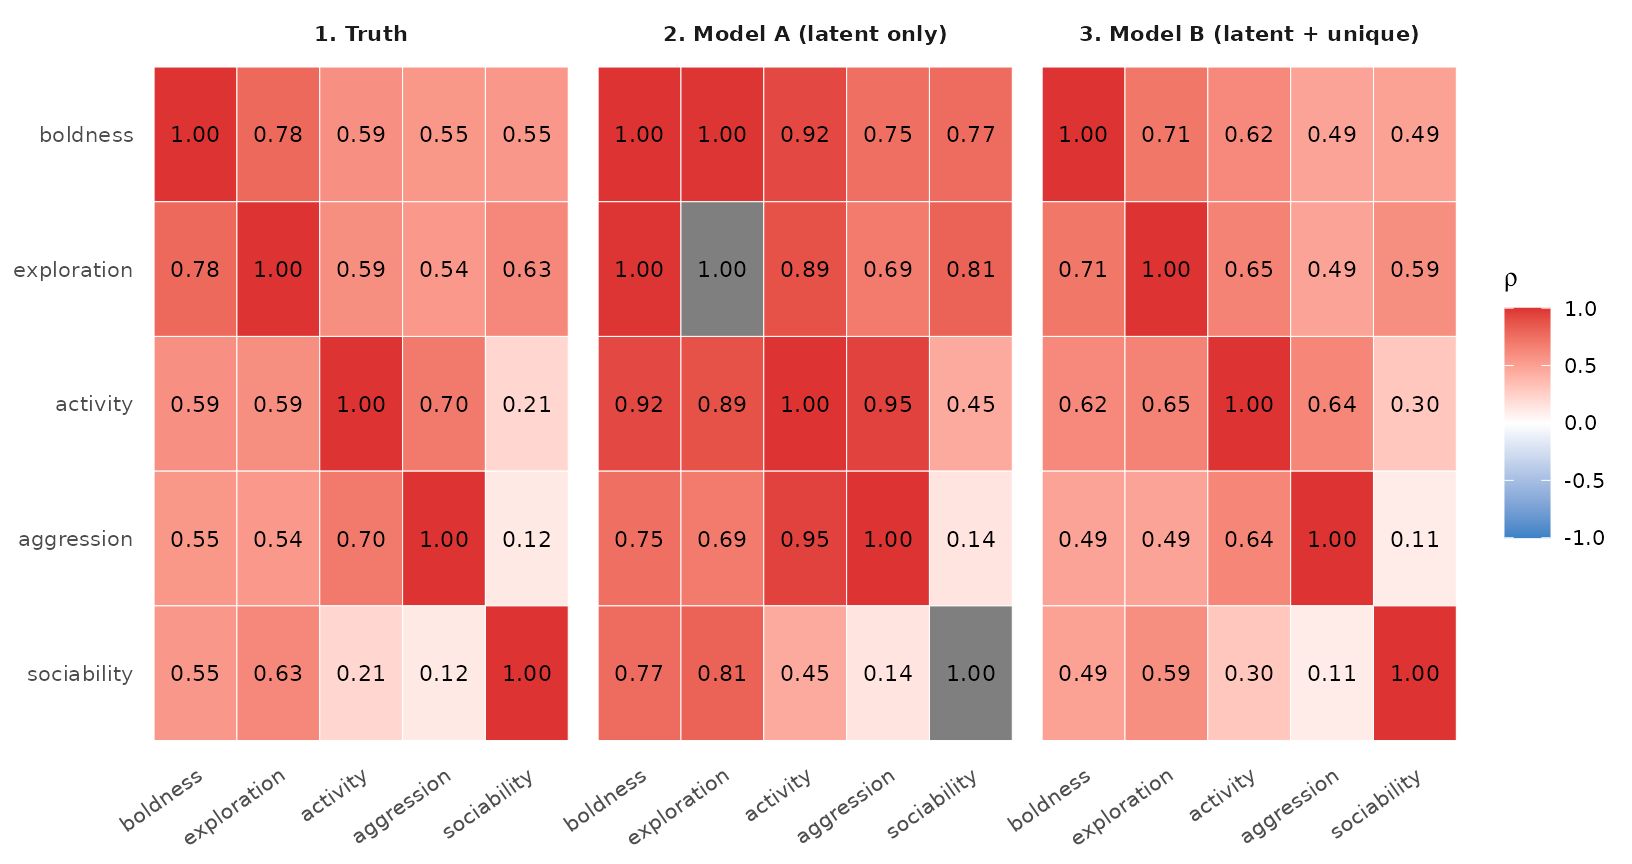
Trait-pair correlation errors for the no-residual latent subset and the ordinary latent model with Psi. Positive values mean the fitted correlation is larger than truth; zero means exact recovery for that pair.
Model A shows correlations that are uniformly
larger than truth. Model B pulls those errors back
toward zero. The mechanism: Model A’s
has small diagonals (only
),
so when we divide by
the off-diagonals get inflated. Model B’s
has the full
— diagonals at the right scale and correlations at the right
magnitude.
Report-ready Sigma rows
For reports, make the row object first. Each covariance target is one tidy row with trait names, matrix part, estimate, and interval placeholders:
sigma_rows_B <- extract_Sigma_table(
  fit_B,
  level = "unit",
  part = "total",
  measure = "covariance",
  entries = "upper"
)
sigma_rows_B
#>                               estimand     trait_i     trait_j i j level
#> 1     Sigma_unit[boldness,exploration]    boldness exploration 1 2  unit
#> 2        Sigma_unit[boldness,activity]    boldness    activity 1 3  unit
#> 3     Sigma_unit[exploration,activity] exploration    activity 2 3  unit
#> 4      Sigma_unit[boldness,aggression]    boldness  aggression 1 4  unit
#> 5   Sigma_unit[exploration,aggression] exploration  aggression 2 4  unit
#> 6      Sigma_unit[activity,aggression]    activity  aggression 3 4  unit
#> 7     Sigma_unit[boldness,sociability]    boldness sociability 1 5  unit
#> 8  Sigma_unit[exploration,sociability] exploration sociability 2 5  unit
#> 9     Sigma_unit[activity,sociability]    activity sociability 3 5  unit
#> 10  Sigma_unit[aggression,sociability]  aggression sociability 4 5  unit
#>    component matrix   estimate lower upper interval_method interval_status
#> 1      total  Sigma 1.07402144    NA    NA            none            none
#> 2      total  Sigma 0.81822573    NA    NA            none            none
#> 3      total  Sigma 0.82114850    NA    NA            none            none
#> 4      total  Sigma 0.62593615    NA    NA            none            none
#> 5      total  Sigma 0.61861430    NA    NA            none            none
#> 6      total  Sigma 0.92599363    NA    NA            none            none
#> 7      total  Sigma 0.70478570    NA    NA            none            none
#> 8      total  Sigma 0.80148210    NA    NA            none            none
#> 9      total  Sigma 0.20836037    NA    NA            none            none
#> 10     total  Sigma 0.09644841    NA    NA            none            none
#>     scale diagonal triangle
#> 1  latent    FALSE    upper
#> 2  latent    FALSE    upper
#> 3  latent    FALSE    upper
#> 4  latent    FALSE    upper
#> 5  latent    FALSE    upper
#> 6  latent    FALSE    upper
#> 7  latent    FALSE    upper
#> 8  latent    FALSE    upper
#> 9  latent    FALSE    upper
#> 10 latent    FALSE    upper
part = "total" is the default and is what you almost
always want for reporting. "shared" is useful if you
specifically want the latent-implied component (e.g. for ordination
interpretation or communality). "unique" returns the
diagonal of
as table rows (matrix = "Psi",
component = "unique", one row per trait); it has no
s component and does not accept part = "psi".
For the raw named vector, use
extract_Sigma(fit, part = "unique")$s (alias
part = "psi"), shown below.
The same table helper exposes the three decomposition parts without hand-indexing matrices:
sigma_part_rows_B <- rbind(
  extract_Sigma_table(fit_B, level = "unit", part = "shared", entries = "diag"),
  extract_Sigma_table(fit_B, level = "unit", part = "unique", entries = "diag"),
  extract_Sigma_table(fit_B, level = "unit", part = "total", entries = "diag")
)

sigma_part_rows_B[c("component", "matrix", "trait_i", "trait_j", "estimate")]
#>    component matrix     trait_i     trait_j  estimate
#> 1     shared  Sigma    boldness    boldness 1.0021764
#> 2     shared  Sigma exploration exploration 1.1580276
#> 3     shared  Sigma    activity    activity 1.1111348
#> 4     shared  Sigma  aggression  aggression 0.7795354
#> 5     shared  Sigma sociability sociability 0.7997183
#> 6     unique    Psi    boldness    boldness 0.2852568
#> 7     unique    Psi exploration exploration 0.2089866
#> 8     unique    Psi    activity    activity 0.3743567
#> 9     unique    Psi  aggression  aggression 0.2588518
#> 10    unique    Psi sociability sociability 0.4533521
#> 11     total  Sigma    boldness    boldness 1.2874332
#> 12     total  Sigma exploration exploration 1.3670143
#> 13     total  Sigma    activity    activity 1.4854915
#> 14     total  Sigma  aggression  aggression 1.0383871
#> 15     total  Sigma sociability sociability 1.2530704
If you need a matrix for algebra checks, use
extract_Sigma() directly:
# Lambda Lambda^T alone (the "shared" component)
extract_Sigma(fit_B, level = "unit", part = "shared")$Sigma |> round(2)
#>             boldness exploration activity aggression sociability
#> boldness        1.00        1.07     0.82       0.63        0.70
#> exploration     1.07        1.16     0.82       0.62        0.80
#> activity        0.82        0.82     1.11       0.93        0.21
#> aggression      0.63        0.62     0.93       0.78        0.10
#> sociability     0.70        0.80     0.21       0.10        0.80

# psi -- trait-specific diagonal variances (the `part = "unique"` component)
extract_Sigma(fit_B, level = "unit", part = "unique")$s |> round(2)
#>    boldness exploration    activity  aggression sociability
#>        0.29        0.21        0.37        0.26        0.45

# Sigma_unit = Lambda Lambda^T + Psi (the "total" -- what you usually want)
extract_Sigma(fit_B, level = "unit", part = "total")$Sigma |> round(2)
#>             boldness exploration activity aggression sociability
#> boldness        1.29        1.07     0.82       0.63        0.70
#> exploration     1.07        1.37     0.82       0.62        0.80
#> activity        0.82        0.82     1.49       0.93        0.21
#> aggression      0.63        0.62     0.93       1.04        0.10
#> sociability     0.70        0.80     0.21       0.10        1.25
plot_Sigma_table(sigma_rows_B, sort = "magnitude")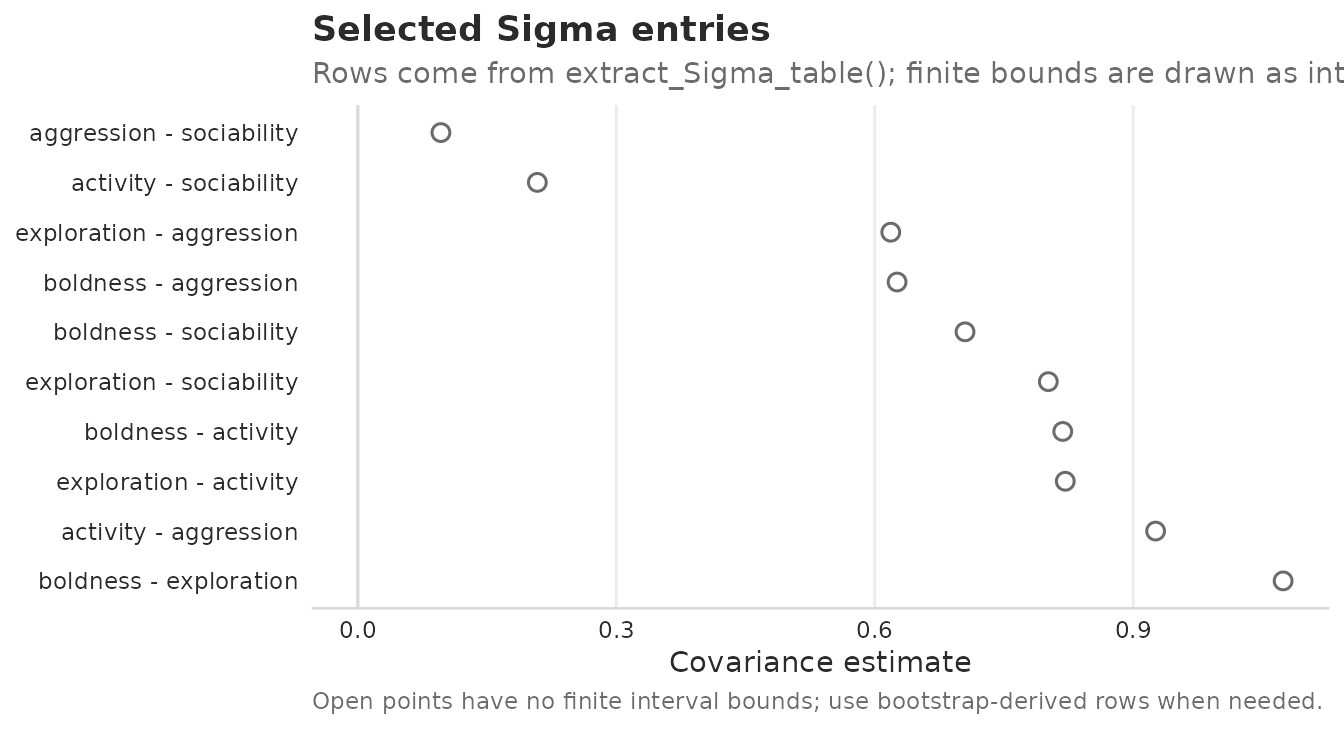
Upper-triangle off-diagonal entries of Sigma_unit from the ordinary latent model with Psi. Open points mark point estimates without finite interval bounds; this figure does not add uncertainty beyond the rows supplied to the plot.
Communality and ICC use the covariance specified by the model
These trait-level summaries answer different questions. Communality uses the chosen shared-plus-diagonal decomposition; ICC uses the variances at its participating levels. In this worked example, the data-generating model has nonzero Psi, so omitting it changes the covariance target and these summaries. A deliberately specified loadings-only covariance is a different model, not an automatic error.
Communality
This is the fraction of trait ’s variance explained by the shared latent variables. It is bounded between 0 and 1 and is a proportion-of-variance summary, analogous in scale to (heritability) or . Like the other -derived summaries it is a model-based factor-analytic quantity of the fitted GLLVM — computed from the fitted covariance decomposition, not a PCA or exploratory-factor-analysis eigen-decomposition of the raw data.
For a reader-facing table, the alignment is:
| Symbol | R output | Interpretation |
|---|---|---|
extract_communality(fit, level = "unit") |
Fraction of trait t variance explained by the shared
latent variables. |
|
| numerator |
extract_Sigma(fit, level = "unit", part = "shared")
diagonal |
Shared variance for trait t. |
| denominator |
extract_Sigma(fit, level = "unit", part = "total")
diagonal |
Shared variance plus trait-specific diagonal variance. |
The catch: with no-residual latent fits,
for every trait by construction, so
for every trait — the communality is identically 1 and tells you
nothing. Ordinary latent() gives the denominator a
per-trait
slot by default, so communality need not be fixed at one. Its
interpretation still depends on the chosen decomposition and whether
that decomposition is identifiable.
extract_communality(fit_A, level = "unit")  # no-residual fit: all = 1
#>    boldness exploration    activity  aggression sociability
#>           1           1           1           1           1
extract_communality(fit_B, level = "unit")  # ordinary latent with Psi
#>    boldness exploration    activity  aggression sociability
#>   0.7784298   0.8471218   0.7479913   0.7507175   0.6382070
By default, extract_correlations() returns a table of
unique pairs, rather than a square matrix. For eight items it has 28
rows: A-B is present once, without B-A or the diagonal. The first item
appears only in trait_i, and the last only in
trait_j; both are present in the combined table. This is
also true for ordinal_probit() fits. Directly plotting
these rows with geom_tile() leaves half the cells blank.
Alphabetical axis ordering can make the gaps look scattered.
Use the package plot for a symmetric display:
plot_correlations(fit_B, tier = "unit", style = "heatmap", triangle = "full")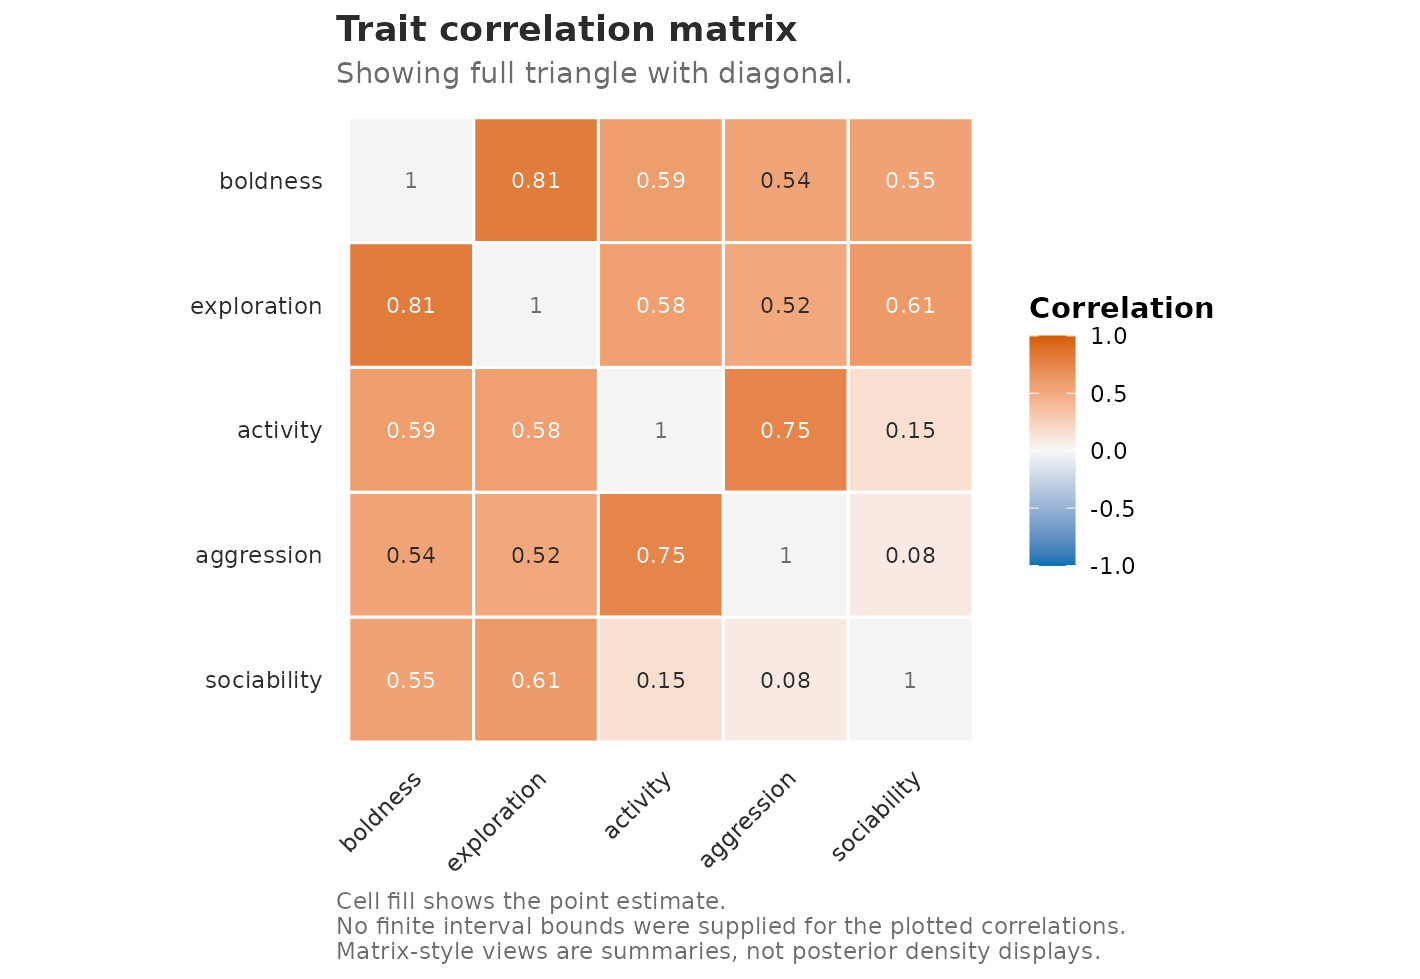
For a custom plot, request a full table directly from the correlation extractor. For matrix calculations, request the square matrix:
R_B <- extract_Sigma(fit_B, level = "unit", link_residual = "auto")$R
full_B <- extract_correlations(
  fit_B, tier = "unit", entries = "all", link_residual = "auto"
)
# Both directions, without self-pairs:
offdiag_B <- extract_correlations(
  fit_B, tier = "unit", entries = "offdiag", link_residual = "auto"
)
The full table retains the correlation column and
interval schema. Diagonal rows are fixed at 1, with
method = "fixed" and no estimated interval. Mirrored rows
carry the same interval bounds and should not be counted as independent
estimates. Keep entries = "unique" for pairwise analyses
and interval/eye plots. Numeric pair indices must be finite whole
numbers. When passing a full table to a matrix plot, mirrored rows must
have matching estimates, intervals and provenance; conflicting rows
produce an error instead of an order-dependent plot. The
pair argument is restricted to that unique layout. For
ordinal probit responses, link_residual = "auto" reports
correlations on the underlying liability scale, rather than Pearson
correlations of the observed category labels.
For the report surface, keep the exact table but display the rows as
a matrix. extract_correlations() supplies the point
estimates and Fisher-z interval bounds; plot_correlations()
arranges those supplied values for reading, with estimates in the upper
triangle and interval bounds in the lower triangle:
corr_B <- extract_correlations(
  fit_B, tier = "unit", method = "fisher-z"
)
corr_B
#>    tier     trait_i     trait_j correlation        lower     upper   method
#> 1  unit    boldness exploration  0.80958800  0.752421153 0.8546497 fisher-z
#> 2  unit    boldness    activity  0.59166474  0.487597552 0.6791548 fisher-z
#> 3  unit exploration    activity  0.57623561  0.469546685 0.6663385 fisher-z
#> 4  unit    boldness  aggression  0.54136232  0.429073679 0.6371733 fisher-z
#> 5  unit exploration  aggression  0.51922283  0.403611047 0.6185142 fisher-z
#> 6  unit    activity  aggression  0.74557830  0.672670178 0.8041486 fisher-z
#> 7  unit    boldness sociability  0.55489013  0.444720344 0.6485196 fisher-z
#> 8  unit exploration sociability  0.61237799  0.511971130 0.6962769 fisher-z
#> 9  unit    activity sociability  0.15271873  0.006602907 0.2924496 fisher-z
#> 10 unit  aggression sociability  0.08455274 -0.062483305 0.2279964 fisher-z
#>          interval_status
#> 1  heuristic_unvalidated
#> 2  heuristic_unvalidated
#> 3  heuristic_unvalidated
#> 4  heuristic_unvalidated
#> 5  heuristic_unvalidated
#> 6  heuristic_unvalidated
#> 7  heuristic_unvalidated
#> 8  heuristic_unvalidated
#> 9  heuristic_unvalidated
#> 10 heuristic_unvalidated
plot_correlations(
  corr_B,
  style = "heatmap",
  matrix_layout = "estimate_ci",
  title = "Ordinary latent trait correlations",
  caption = "Fill shows estimates; lower labels show supplied Fisher-z bounds."
)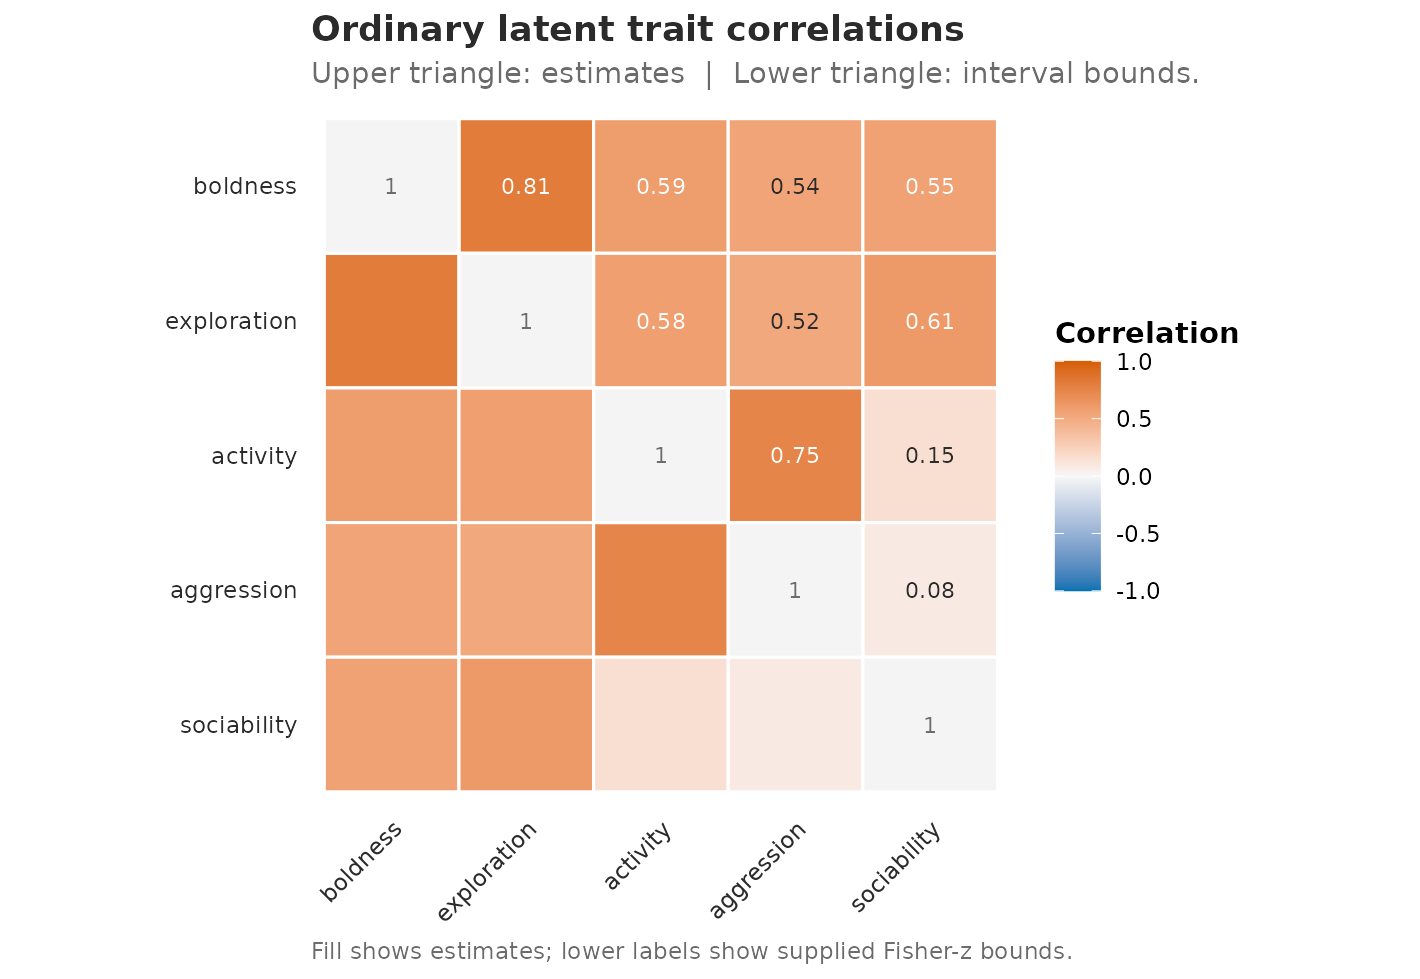
Pairwise correlations from the ordinary latent model with Psi. Upper cells show point estimates; lower cells display the Fisher-z interval columns already present in the extractor output.
Read this as a formatted table, not as a new uncertainty calculation.
It is a display of the rows returned by
extract_correlations(): it does not bootstrap, profile, or
calibrate uncertainty — it only renders the Fisher-z interval columns
already present in corr_B. Those bounds are themselves
nominal Fisher-z
(Wald-on-)
intervals: their empirical coverage has not been calibrated and they do
not establish repeated-sampling coverage for gllvmTMB’s latent
covariances, so read them as an uncertainty display, not a calibrated
interval.
Site-level / individual-level ICC
For two-level fits the site-level (individual-level) ICC is
i.e. the proportion of total trait variance attributable to between-
unit differences. Each participating level needs a covariance model
appropriate to the estimand. Use latent() at a level when
its cross-trait shared structure is part of the question, giving
;
use indep() when that level is intended to be diagonal.
Shared factors are therefore not required at every level for an ICC.
In gllvmTMB this is (pattern, not run in this article)
extract_ICC_site(fit)— see the two-level example below, which uses shared structure at both levels because that is its scientific question.
Binomial responses: the link’s implicit residual
Binary outcomes (family = binomial()) are a special
case. The link function fixes a latent-scale residual variance:
for logit,
for probit,
for cloglog. This fixed family/link residual is distinct
from an estimated between-unit
or an observation-level random effect. Whether an additional diagonal
component is identifiable depends on the estimand, model specification,
and supporting evidence; this article does not establish that
question.
extract_Sigma() has a
link_residual = "auto" option that adds the link-specific
implicit residual to
for the marginal latent-scale interpretation:
# (illustrative — not run; needs a binary fit)
extract_Sigma(fit_binary, level = "unit", part = "total",
              link_residual = "auto")
For continuous traits, the recommended starting pattern is ordinary
latent(), which includes the diagonal Psi companion by
default. For count, mixed-family, phylogenetic, and spatial fits, use
the same idea only after checking that the fit converged; see the
corresponding family article for worked examples.
Two-level (between + within) models: two latent()
terms
For repeated-measures data, use latent() at a level when
a shared cross-trait covariance is intended there (Nakagawa &
Schielzeth 2010; Nakagawa, Johnson & Schielzeth 2017). The following
unrun illustration chooses that structure at both levels:
fit_two_level <- gllvmTMB(
  value ~ 0 + trait +
    latent(0 + trait | individual, d = d_B) +
    latent(0 + trait | obs_id, d = d_W),
  data = df,
  trait = "trait",
  unit = "individual",
  unit_obs = "obs_id"
)
giving, for this shared-structure illustration,
(behavioural syndromes — between-individual covariance) and
(integrated plasticity — within-individual covariance). If a
participating level is intended to be diagonal, specify
indep() there instead; its covariance then enters the ICC
denominator without shared axes.
The matching wide-data formula is an unevaluated structural
translation, not a demonstration of long/wide parity. Here
df_wide_repeated denotes a wide data frame with the
individual and obs_id columns required by the
two levels:
Observation-level random effects for non-Gaussian fits
An observation-level random effect (OLRE), a between-unit Psi, and a fixed family/link residual represent different variance conventions. An OLRE can be part of a separately defined model and estimand, but this article does not advertise support or identifiability for NB/Tweedie-plus-OLRE combinations. The following Poisson OLRE pattern is described here but not run in this article:
The
is an estimated diagonal covariance at the observation tier; it is
distinct from a between-unit
and from a fixed family/link residual. Native OLRE support is available:
add an obs_id column (one level per row), include
indep(0 + trait | obs_id) in the formula, pass
unit_obs = "obs_id", and use
extract_residual_split(fit) to separate
(the estimated OLRE variance) from
(the distribution-specific latent residual; Nakagawa & Schielzeth
2010; Nakagawa, Johnson & Schielzeth 2017).
Summary
| You want… | You need | Notes |
|---|---|---|
| Cross-trait correlations on a Gaussian / lognormal / Gamma fit |
latent() at levels where shared cross-trait structure
is intended; indep() for diagonal levels |
latent(..., unique = FALSE) omits Psi and can inflate
correlations. |
| Correlations on a binary fit | Choose latent() for shared cross-trait structure or
indep() for a diagonal tier; use
link_residual = "auto" for the marginal latent scale |
Implicit residual depends on link (π²/3, 1, π²/6); additional variance components need an estimand and evidence. |
| Phylogenetic decomposition | folded phylo_latent(..., unique = TRUE) for the
phylogenetic tier; ordinary latent() for the
non-phylogenetic species tier |
,
with each
using shared + Psi pieces. |
| Communality |
extract_communality(fit) + the right Psi-aware
pattern |
Communality formula uses Σ; needs full Σ to be meaningful. |
Lambda Lambda^T only |
extract_Sigma(fit, part = "shared") |
Useful for ordination. |
Psi / psi only |
extract_Sigma(fit, part = "unique") |
Trait-specific diagonal variances as a vector. |
See also
-
Cross-family correlations
and environmental predictors — shared latent axes across different
response families, environmental predictors of those axes, and a
reference-invariant summary for a
multinomial()trait - Pitfalls — common mistakes including correlation inflation
-
?latent— the ordinary Psi-carrying latent keyword -
?extract_Sigma— the unified extractor -
?suggest_lambda_constraint— a helper for confirmatory loading structures - Formula keyword grid — syntax map for moving from this decomposition to other covariance rows
- Nakagawa & Schielzeth (2010) Repeatability for Gaussian and non-Gaussian data: a practical guide for biologists. Biological Reviews 85(4):935–956. https://doi.org/10.1111/j.1469-185X.2010.00141.x
- Westneat, Wright & Dingemanse (2015) The biology hidden inside residual within-individual phenotypic variation. Biological Reviews 90, 729–743. https://doi.org/10.1111/brv.12131