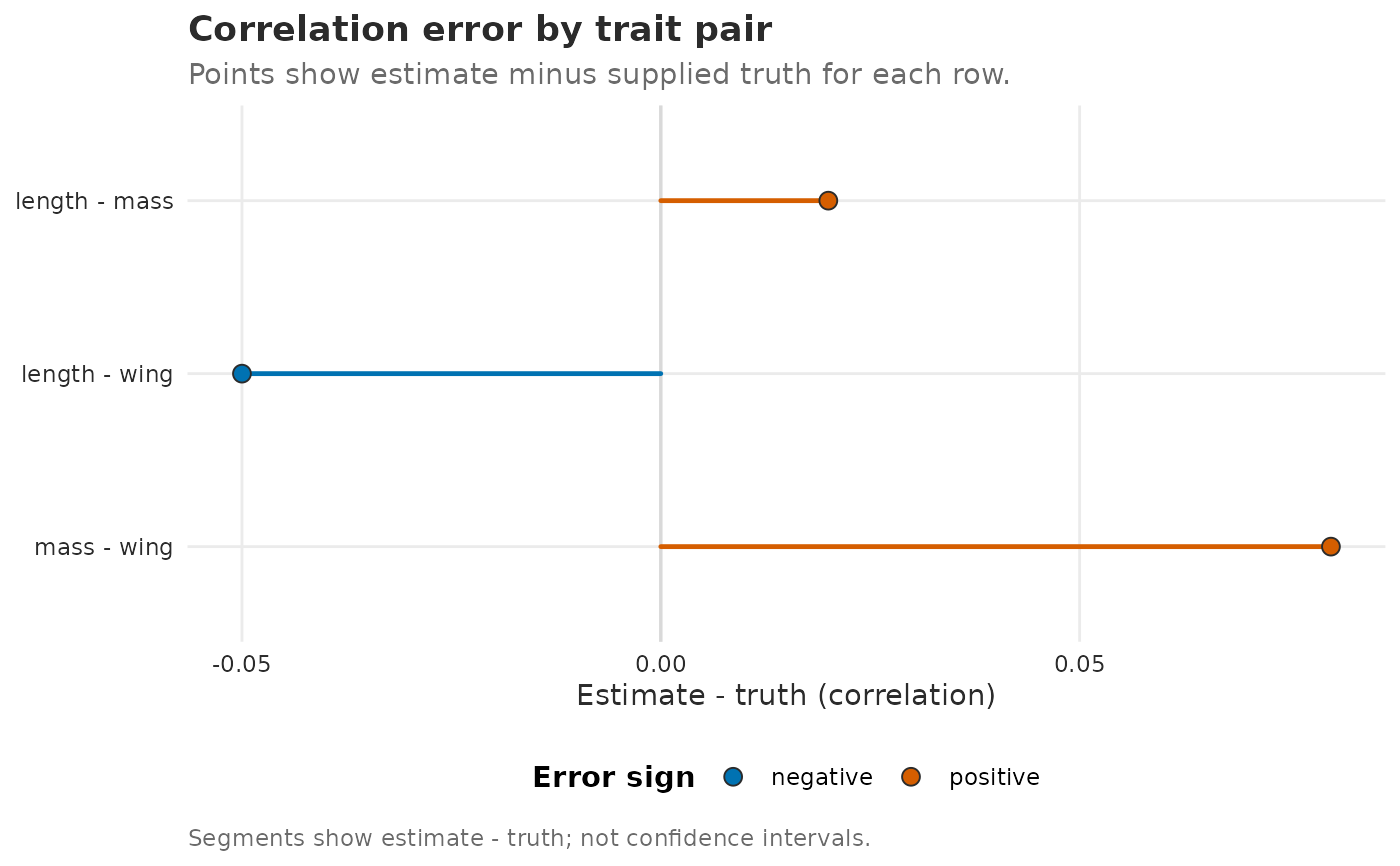
Plot Sigma-table estimates against a known truth matrix
Source:R/plot-covariance-tables.R
plot_Sigma_comparison.Rdplot_Sigma_comparison() turns compare_Sigma_table() rows into a
row-labelled comparison plot. The default style = "difference" shows
estimate - truth for each covariance or correlation row; style = "scatter" shows estimate versus truth with a one-to-one reference line.
Segments in these plots are comparison residuals, not confidence intervals.
Usage
plot_Sigma_comparison(
  x,
  truth,
  level = "unit",
  part = c("total", "shared", "unique"),
  measure = c("covariance", "correlation"),
  entries = c("upper", "unique", "all", "offdiag", "lower", "diag"),
  link_residual = c("auto", "none"),
  include_diagonal = FALSE,
  facet = c("level", "comparison", "none"),
  sort = c("abs_error", "error", "estimate", "truth", "trait", "level"),
  style = c("difference", "scatter")
)
Arguments
- x
A fit returned by
gllvmTMB(), an admittedengine = "julia"bridge fit, a data frame returned byextract_Sigma_table(), or a data frame already returned bycompare_Sigma_table().- truth
Square numeric covariance or correlation matrix passed to
compare_Sigma_table(). May be omitted only whenxalready containstruth,error,abs_error, andcomparison_statuscolumns.- level, part, measure, entries, link_residual
Passed to
compare_Sigma_table()whentruthis supplied.- include_diagonal
Logical. Include diagonal rows if they are present? The default is
FALSEbecause variances are usually on a different scale from pairwise covariance/correlation rows.- facet
One of
"level"(default),"comparison", or"none". Use"comparison"when precomputed rows contain acomparisoncolumn, for example to compare two model specifications against the same truth.- sort
Row ordering for
style = "difference":"abs_error"(default),"error","estimate","truth","trait", or"level".- style
One of
"difference"(default) or"scatter".
Details
Scope: the helper plots compare_Sigma_table() rows or builds
them from a fitted model / Sigma table plus one supplied truth matrix
(covered by the package's comparison-table validation tests, which build on
the underlying Sigma-table extraction tests). It is a visual
comparison helper only: it does not run simulations, compute intervals, or
validate calibration.
Article-specific simulation summaries and richer calibration plots
remain future work.
Examples
if (requireNamespace("ggplot2", quietly = TRUE)) {
  rows <- data.frame(
    level = "unit",
    trait_i = c("length", "length", "mass"),
    trait_j = c("mass", "wing", "wing"),
    estimate = c(0.62, -0.10, 0.28),
    lower = NA_real_,
    upper = NA_real_,
    matrix = "R",
    component = "total",
    diagonal = FALSE,
    triangle = "upper",
    scale = "correlation"
  )
  truth_R <- matrix(
    c(1, 0.60, -0.05, 0.60, 1, 0.20, -0.05, 0.20, 1),
    3,
    byrow = TRUE,
    dimnames = list(
      c("length", "mass", "wing"),
      c("length", "mass", "wing")
    )
  )
  plot_Sigma_comparison(rows, truth_R, measure = "correlation")
}