
Fitted-model predictive checks for a multivariate gllvmTMB fit
Source: R/predictive-diagnostics.R
predictive_check.Rdpredictive_check() compares the observed stacked-trait response to
draws from the fitted model. The frequentist semantics are explicit:
these are fitted-model predictive checks, not Bayesian posterior
predictive checks.
Usage
predictive_check(
  object,
  type = c("rq_qq", "rootogram", "stat_grouped", "dens_overlay"),
  nsim = NULL,
  ndraws = NULL,
  seed = NULL,
  trait = NULL,
  group = NULL,
  stat = c("mean", "median", "zero_fraction"),
  residual_type = c("randomized_quantile", "simulation_rank"),
  condition_on_RE = TRUE,
  max_count = NULL
)
Arguments
- object
A
gllvmTMB_multifit.- type
Diagnostic plot type.
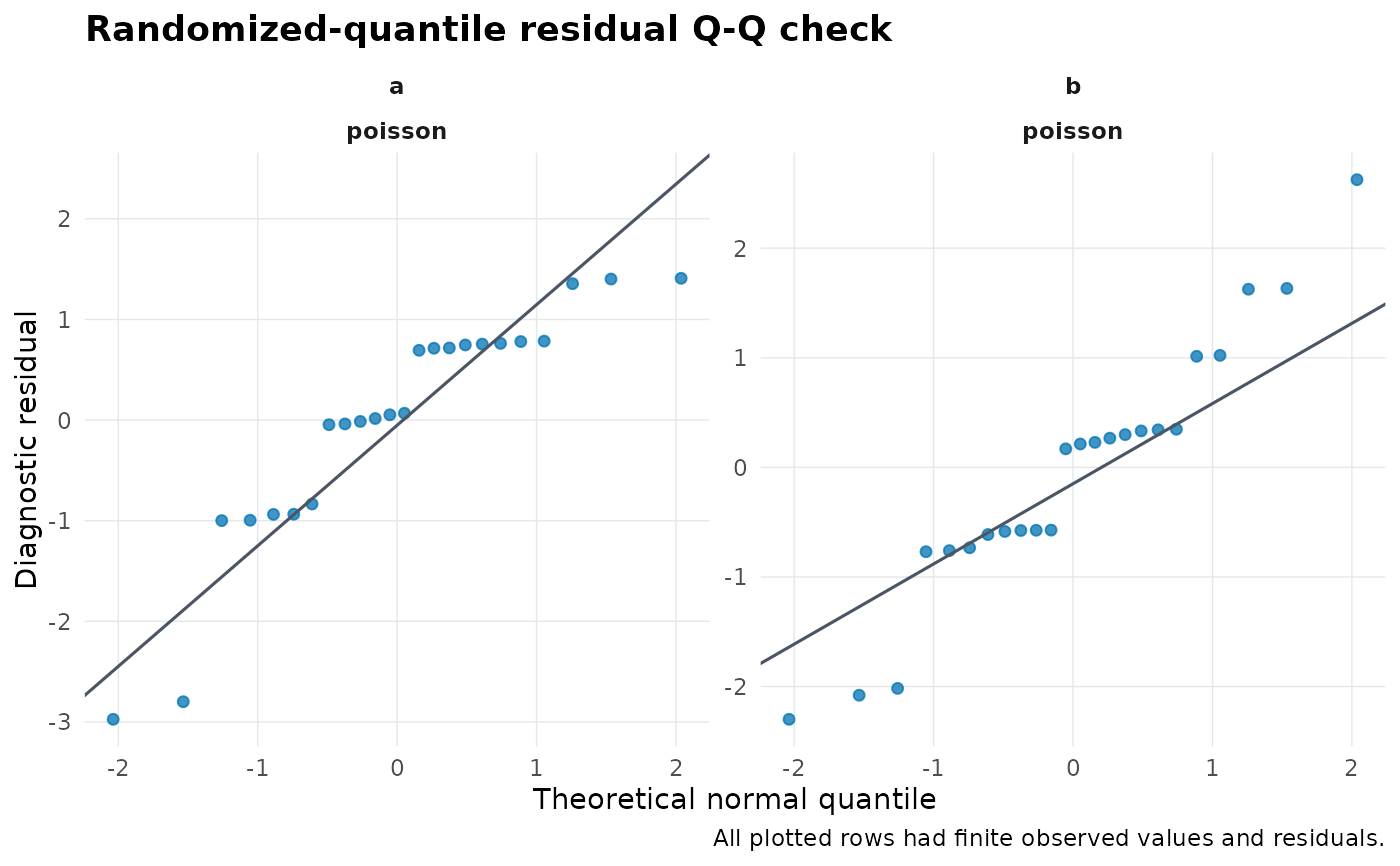
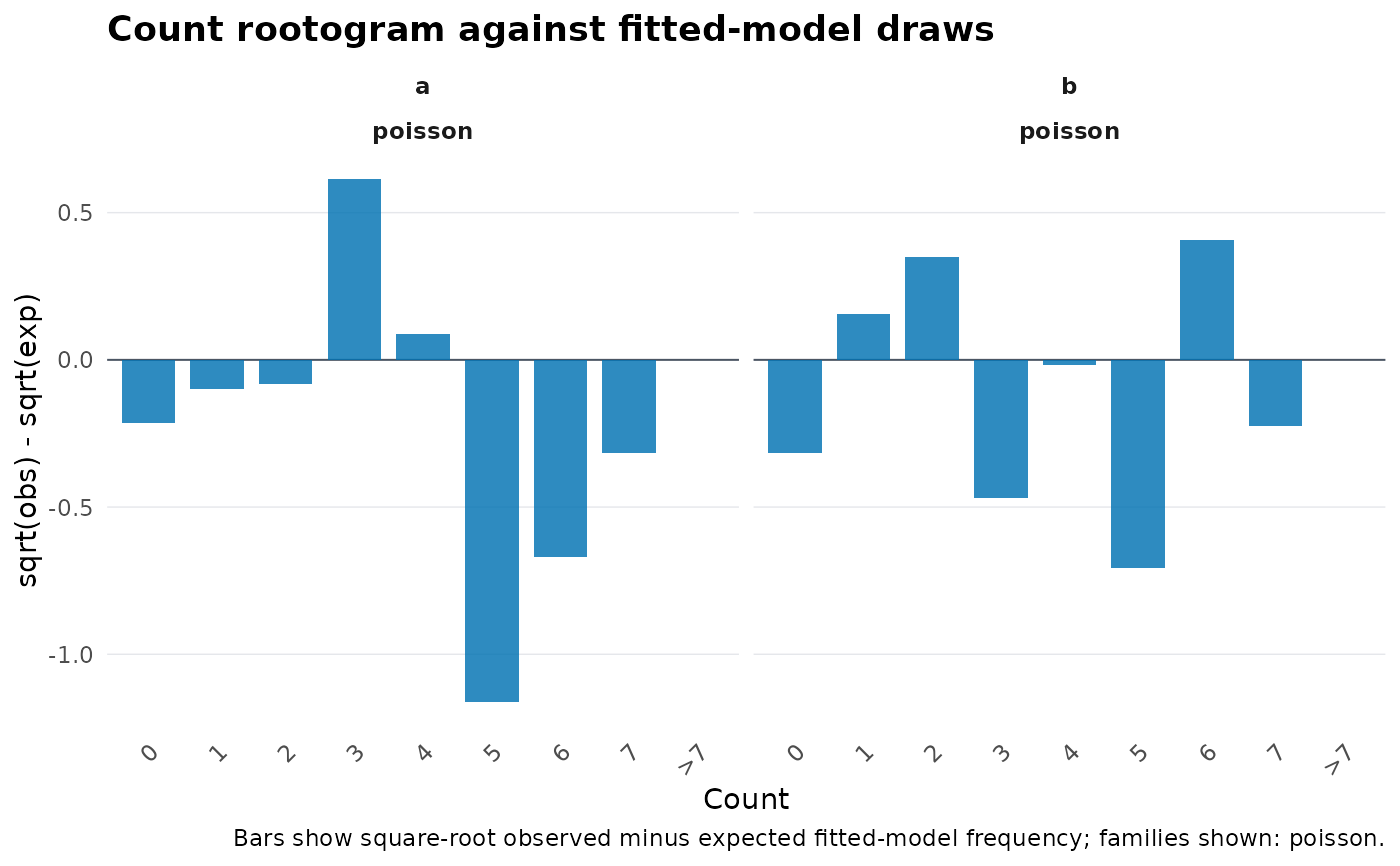
"rq_qq"plots exact randomized- quantile residuals when available;"rootogram"compares observed count frequencies with fitted-model simulated count frequencies;"stat_grouped"compares grouped summary statistics;"dens_overlay"overlays observed and simulated densities and is mainly useful for continuous responses.- nsim, ndraws
Number of fitted-model draws.
ndrawsis accepted as a bayesplot/brms-style alias; supply only one.- seed
Optional RNG seed.
- trait
Optional character vector of trait names to keep.
- group
Row-metadata column used by
"stat_grouped". Default is"trait".- stat
Grouped statistic for
"stat_grouped".- residual_type
Residual type used by
"rq_qq". Defaults to exact"randomized_quantile"residuals;"simulation_rank"is available as a simulation-based fallback.- condition_on_RE
Logical. Passed to
simulate.gllvmTMB_multi()for simulation-based checks. The defaultTRUEchecks the fitted response distribution conditional on fitted random-effect modes.- max_count
Optional upper count shown separately in
"rootogram". Counts larger than this value are pooled into a final">max_count"bin. DefaultNULLchooses a bounded automatic display range and pools larger counts so that a single extreme simulated draw cannot create a very wide rootogram.
Details
The returned object is a ggplot. Its plotted data, fit-health table
from check_gllvmTMB(), and fit$fit_health snapshot are also stored
in attr(plot, "gllvmTMB_diagnostic") so the figure can be audited
without reverse-engineering ggplot layers.
Scope: fitted-model predictive plots and residual Q-Q/rootogram helpers
for gllvmTMB_multi fits, with exact randomized-quantile residuals for
Gaussian, binomial, Poisson, lognormal, Gamma, NB2, Beta, betabinomial,
Student-t, zero-truncated Poisson, zero-truncated NB2, NB1, and
ordinal-probit rows, plus a simulation-rank fallback. These are
diagnostic displays, not formal uniformity, dispersion,
interval-calibration, or Bayesian posterior-predictive tests. Exact
residual support for tweedie, the delta/hurdle families, and multinomial
is not implemented (see residuals.gllvmTMB_multi() for why); the
simulation-rank fallback's own family coverage is separately limited and
is not audited here.
Examples
# \donttest{
set.seed(1)
n <- 24
df <- data.frame(
unit = factor(rep(seq_len(n), each = 2)),
trait = factor(rep(c("a", "b"), n)),
value = rpois(2 * n, lambda = 2)
)
fit <- gllvmTMB(
value ~ 0 + trait + latent(0 + trait | unit, d = 1),
data = df,
trait = "trait",
unit = "unit",
family = poisson()
)
predictive_check(fit, type = "rq_qq", seed = 1)
 predictive_check(fit, type = "rootogram", ndraws = 20, seed = 1)
 # }
# }