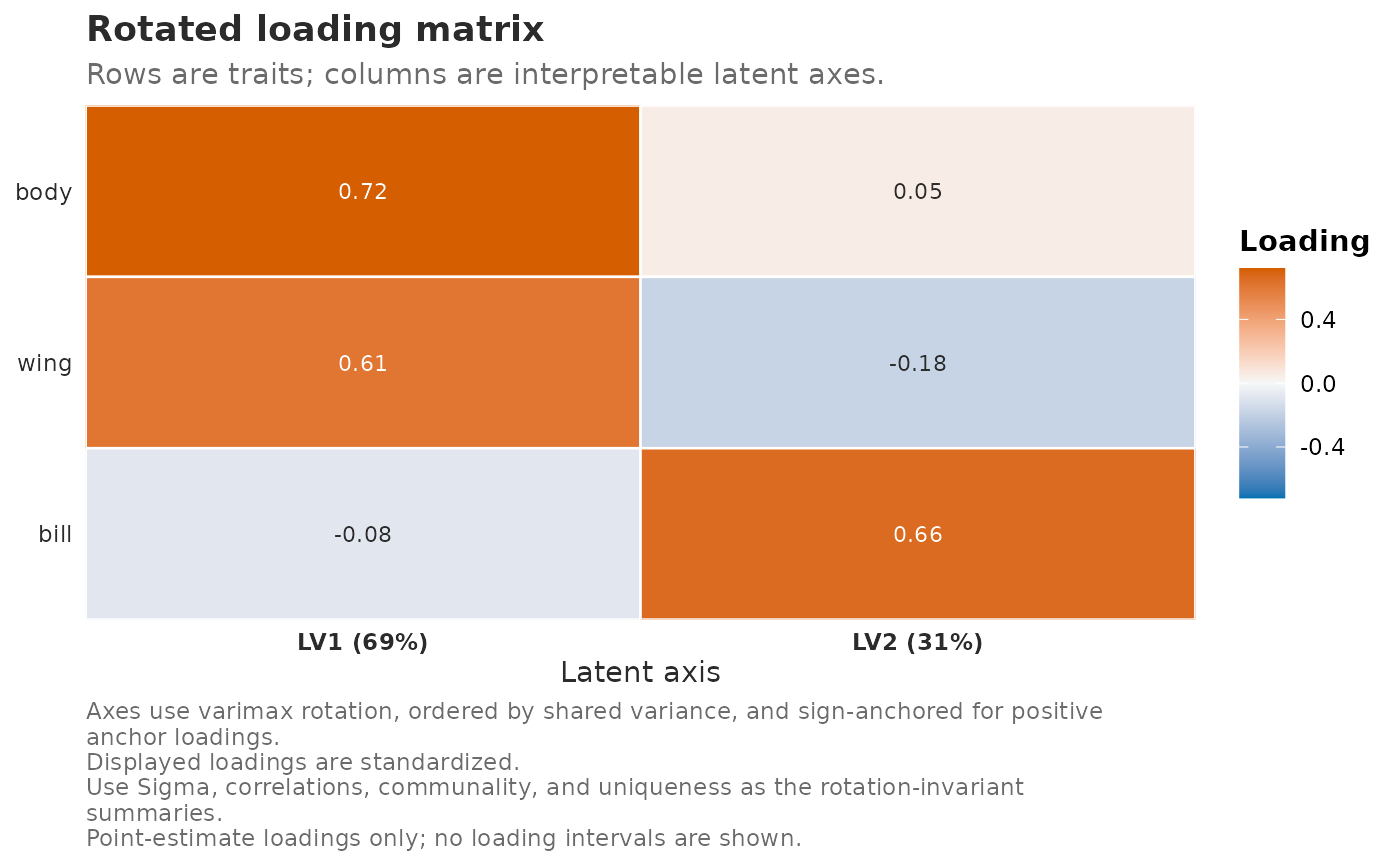
plot_rotated_loadings() turns the tidy rows from
extract_rotated_loadings_table() into a publication-oriented loading
matrix. It can also extract the table from a fitted gllvmTMB() model.
Rows are traits, columns are latent axes, and colour shows the signed
loading after the requested rotation, axis ordering, sign anchoring, and
loading scale.
Usage
plot_rotated_loadings(
  x,
  level = "unit",
  method = c("varimax", "promax", "none"),
  order_axes = TRUE,
  sign_anchor = c("auto", "none"),
  anchor_traits = NULL,
  loading_scale = c("standardized", "raw"),
  sort = c("dominant", "abs_loading", "trait"),
  show_values = NULL,
  digits = 2L,
  limits = NULL,
  facet = c("level", "none")
)
Arguments
- x
A fit returned by
gllvmTMB()or a data frame returned byextract_rotated_loadings_table().- level
"unit"(between-unit) or"unit_obs"(within-unit), passed toextract_rotated_loadings_table()whenxis a fitted model. Deprecated aliases"B"and"W"are still accepted with a warning.- method
One of
"varimax","promax", or"none"; passed toextract_rotated_loadings_table()for fitted-model calls.- order_axes
Logical. When
TRUE, reorder rotated axes by decreasing raw shared variance before plotting. Ignored whenmethod = "none".- sign_anchor
One of
"auto"or"none"."auto"flips each rotated axis so its anchor trait has a positive loading. Ignored whenmethod = "none".- anchor_traits
Optional character vector of trait names used for sign anchoring. Supply one trait per axis after ordering. Axes without a supplied anchor use the trait with the largest absolute loading.
- loading_scale
One of
"standardized"or"raw"for fitted-model calls. The default"standardized"puts loadings on a correlation-like scale for figures. Ignored whenxis already a data frame.- sort
Trait ordering.
"dominant"groups traits by the axis on which they have their largest absolute loading."abs_loading"orders by each trait's largest absolute loading."trait"preserves the incoming trait order.- show_values
Logical or
NULL. WhenNULL, numeric tile labels are shown for matrices with at most 80 cells.- digits
Number of decimal places for tile labels.
- limits
Optional two-number colour-scale limits. When
NULL, limits are symmetric around zero and based on the plotted loadings.- facet
One of
"level"or"none". Data frames containing more than one covariance level are faceted by level by default.
Details
Scope: the helper plots point-estimate rotated loading rows from
extract_rotated_loadings_table() for fitted latent() components
(this builds on the package's rotated-loadings extraction validation).
The plot does not compute or display loading uncertainty intervals
and does not make rotated axes uniquely biological. Bootstrap- or
simulation-aligned loading uncertainty remains a later inference
slice.
Examples
if (requireNamespace("ggplot2", quietly = TRUE)) {
  rows <- data.frame(
    level = "unit",
    trait = rep(c("body", "wing", "bill"), times = 2),
    axis = rep(c("LV1", "LV2"), each = 3),
    loading = c(0.72, 0.61, -0.08, 0.05, -0.18, 0.66),
    abs_loading = abs(c(0.72, 0.61, -0.08, 0.05, -0.18, 0.66)),
    axis_variance = rep(c(1.1, 0.5), each = 3),
    axis_share = rep(c(0.69, 0.31), each = 3),
    rotation = "varimax",
    order_axes = TRUE,
    sign_anchor = "auto",
    anchor_trait = rep(c("body", "bill"), each = 3),
    loading_scale = "standardized"
  )
  plot_rotated_loadings(rows)
}