Confidence Eye plot for per-species loading uncertainty
Source:R/plot-loadings-confidence-eye.R
plot_loadings_confidence_eye.RdA bar-and-whisker visualisation of raw or standardised loadings with
point estimates and Wald (or other-method) confidence intervals from
loading_ci(). Default rendering uses the "Confidence Eye" contract:
a pale CI region (geom_linerange) and a hollow point estimate
(geom_point, shape = 21, fill white) so the visual weight rests on
the uncertainty rather than the point.
Usage
plot_loadings_confidence_eye(
  fit,
  level = "unit",
  method = "wald",
  conf_level = 0.95,
  null_region = NULL,
  sort_by = c("trait_order", "magnitude"),
  ylim = NULL,
  loading_scale = NULL
)
Arguments
- fit
A multivariate
gllvmTMB()fit, OR a data frame already produced byloading_ci()/flag_unreliable_loadings().- level, method, conf_level, loading_scale
Forwarded to
loading_ci()whenfitis a fit object. Ignored whenfitis already aloading_ci()data frame, except that an explicitly suppliedloading_scalemust match the frame's recorded scale. The y-axis label reports the displayed scale.- null_region
Optional length-2 numeric drawn as a shaded "biologically negligible" band so the reader can tell at a glance which CIs sit outside it. If supplied, also colours points by reliability via
flag_unreliable_loadings(). DefaultNULL(no band drawn).- sort_by
Character, one of
"trait_order"(the order of thetraitfactor, the default) or"magnitude". Note"magnitude"applies a single global trait ordering keyed by each trait's largest absolute loading across axes; the shared discrete x-axis cannot reorder traits within individual facets.- ylim
Optional length-2 numeric vector clipping the y-axis via
coord_cartesian(). Useful when one degenerate loading estimate would otherwise blow out the scale and crush the rest. DefaultNULL(no clipping).
Details
The closest published precedent for an uncertainty-aware per-species loading display in JSDM is the site-score uncertainty plot of Hoegh & Roberts (2020, doi:10.1002/ece3.5752), but that targets site scores rather than species loadings. To my knowledge no equivalent plot of per-species Lambda uncertainty exists in the ML/TMB JSDM lineage (gllvm, sjSDM, ecoCopula).
Examples
set.seed(1)
# Eight traits measured twice on each of 100 units (e.g. sites).
# Odd-numbered traits respond to one latent gradient and even-numbered
# traits to another; trait_7 responds only weakly.
Lambda <- cbind(c(0.9, 0, 0.7, 0, 0.6, 0, 0.15, 0),
                c(0, 0.9, 0, 0.8, 0, 0.6, 0, 0.5))
sim <- simulate_unit_trait(n_units = 100, n_obs_per_unit = 2,
                           n_traits = 8, Lambda_B = Lambda,
                           psi_B = 0.5, sigma2_eps = 0.3)
# Confirmatory fit: odd traits load only on axis 1, even traits only on
# axis 2 (see ?loading_ci).
M <- confirmatory_lambda(species = levels(sim$data$trait),
                         group = rep(c("A", "B"), times = 4), d = 2,
                         loads_on = list(A = 1, B = 2),
                         anchors = c(NA, NA))
fit <- gllvmTMB(value ~ 0 + trait +
                  latent(0 + trait | unit, d = 2, unique = TRUE),
                data = sim$data, trait = "trait", unit = "unit",
                lambda_constraint = list(unit = M))

if (requireNamespace("ggplot2", quietly = TRUE)) {
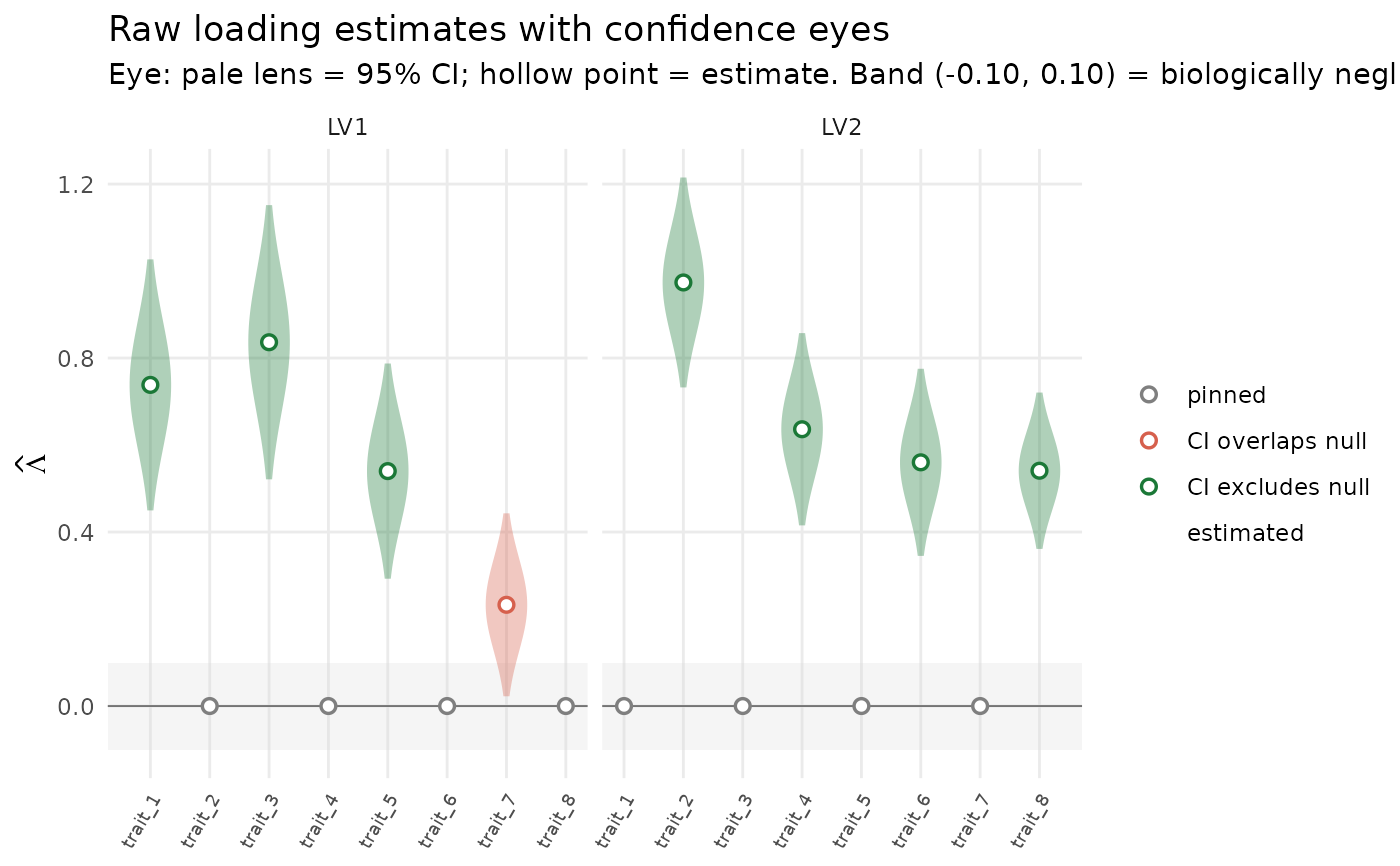
  # One panel per latent axis. Each hollow point is an estimated loading
  # and the shaded "eye" around it is its 95% interval; grey points are
  # loadings fixed at zero. The grey band marks negligible loadings
  # (-0.1 to 0.1): red eyes reach into it, green eyes stay clear of it.
  print(plot_loadings_confidence_eye(fit, level = "unit",
                                     null_region = c(-0.1, 0.1)))

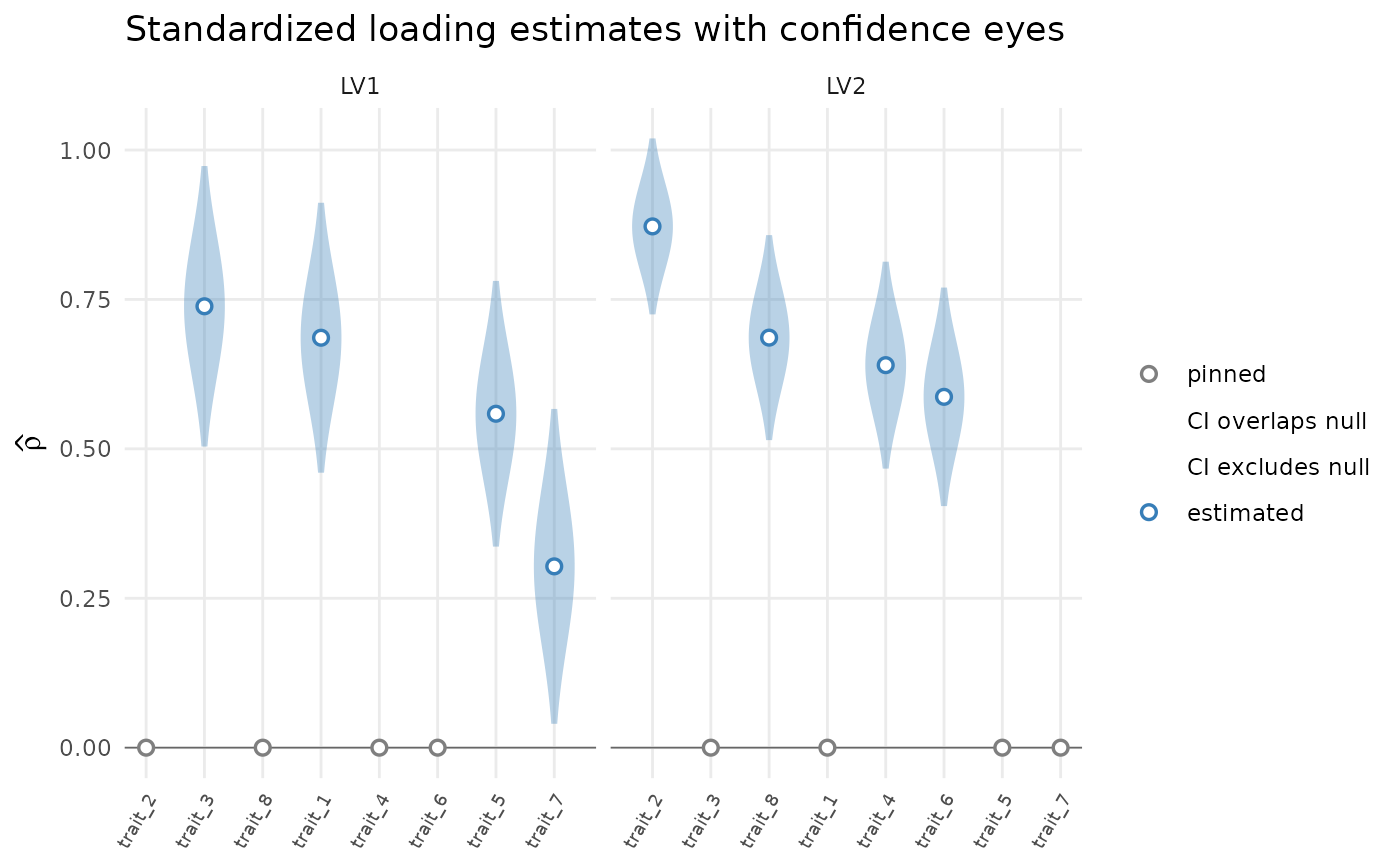
  # The plot also takes a loading_ci() table: here the standardized
  # loadings, with traits ordered by their largest loading.
  ci_std <- loading_ci(fit, loading_scale = "standardized")
  print(plot_loadings_confidence_eye(ci_std, sort_by = "magnitude"))
}