Profile-likelihood curve(s) for entries of the loading matrix
Source:R/loading-profile.R
loading_profile.RdFor each requested entry (i, k) of Lambda_<level>, refit the
model with that entry pinned to a grid of values and return the
resulting log-likelihood curve. The output is a long data.frame
with class profile_loadings; pass it to plot() to visualise the
classic LR U-shape, or to loading_ci() (via method = "profile")
to invert the curve and get CIs that do NOT depend on the fit's
Hessian being positive-definite.
Usage
loading_profile(
  fit,
  level = "unit",
  entries = NULL,
  n_grid = 11L,
  grid_extent = 6,
  conf_level = 0.95
)
Arguments
- fit
A confirmatory
gllvmTMB()multi-trait fit.- level
Which loading matrix:
"unit"(default) or"unit_obs". Legacy"B"/"W"accepted with deprecation.- entries
Optional matrix or data.frame of
(i, k)index pairs specifying which Lambda entries to profile. DefaultNULLprofiles every entry that is NOT pinned (i.e. every free entry the data informs). Pinned entries are skipped.- n_grid
Integer; number of grid points per entry. Default 11.
- grid_extent
Numeric; total grid width as a multiple of a robust scale estimate of the loading (default 6 — i.e. estimate ± 3 scale units on each side). At pdHess-OK fits the scale is the Wald SE; otherwise a heuristic based on
|Lambda|/2 + 0.5.- conf_level
Confidence level for the eventual CI inversion; stored on the output for downstream consumers.
Value
A data.frame of class profile_loadings with columns:
trait, axis, i, k, profile_value, objective
(the negative log-likelihood evaluated at that value),
delta_deviance (= 2 * (objective - min(objective))),
estimate, conf_level. Pinned entries do not appear in the
output.
Details
Each refit is the fitted model with one loading held fixed: it keeps the
fit's grouping columns (unit, unit_obs, cluster), family, REML
setting and control, so the curve is on the same objective as the fit.
For a ridged fit (gllvmTMBcontrol(loading_ridge = )) that objective is
the penalised one the fit optimised, with the penalty on the held loading
added back; the curve then bottoms out at the fitted loading, but it is a
penalised (MAP) curve and not a plain likelihood-ratio curve. A refit that
fails is reported with a warning giving how many failed and the first error.
This is expensive: each entry requires n_grid partial refits,
so a 20-species 2-factor fit at default n_grid = 11 is ~440 fits.
For binary probit at the scale of this article's fixture, expect
minutes. Use entries to restrict to a subset when iterating.
See also
loading_ci() for the inverted-CI version,
plot.profile_loadings() for the U-shape visualisation.
Examples
set.seed(9)
# Four traits measured twice on each of 100 units (e.g. sites).
# Traits 1-3 respond to one latent gradient; trait_4 does not.
sim <- simulate_unit_trait(n_units = 100, n_obs_per_unit = 2,
                           n_traits = 4,
                           Lambda_B = matrix(c(0.9, 0.7, 0.5, 0)),
                           sigma2_eps = 0.3)
# One latent axis, loadings only (unique = FALSE): in these data the
# gradient is the only source of unit-to-unit differences. The
# confirmatory hypothesis fixes trait_4's loading at zero.
M <- matrix(c(NA, NA, NA, 0), ncol = 1)
fit <- gllvmTMB(value ~ 0 + trait +
                  latent(0 + trait | unit, d = 1, unique = FALSE),
                data = sim$data, trait = "trait", unit = "unit",
                lambda_constraint = list(unit = M))

# Profile trait_2's loading (row 2, column 1 of the loading matrix):
# the model is refitted with that loading held at each of 7 values.
pf <- loading_profile(fit, level = "unit", entries = cbind(2, 1),
                      n_grid = 7)
pf[, c("trait", "profile_value", "delta_deviance")]
#>     trait profile_value delta_deviance
#> 1 trait_2     0.4867392     12.1445897
#> 2 trait_2     0.5484574      4.8798186
#> 3 trait_2     0.6101756      1.1034181
#> 4 trait_2     0.6718939      0.0000000
#> 5 trait_2     0.7336121      0.9088425
#> 6 trait_2     0.7953303      3.3148270
#> 7 trait_2     0.8570485      6.8240909

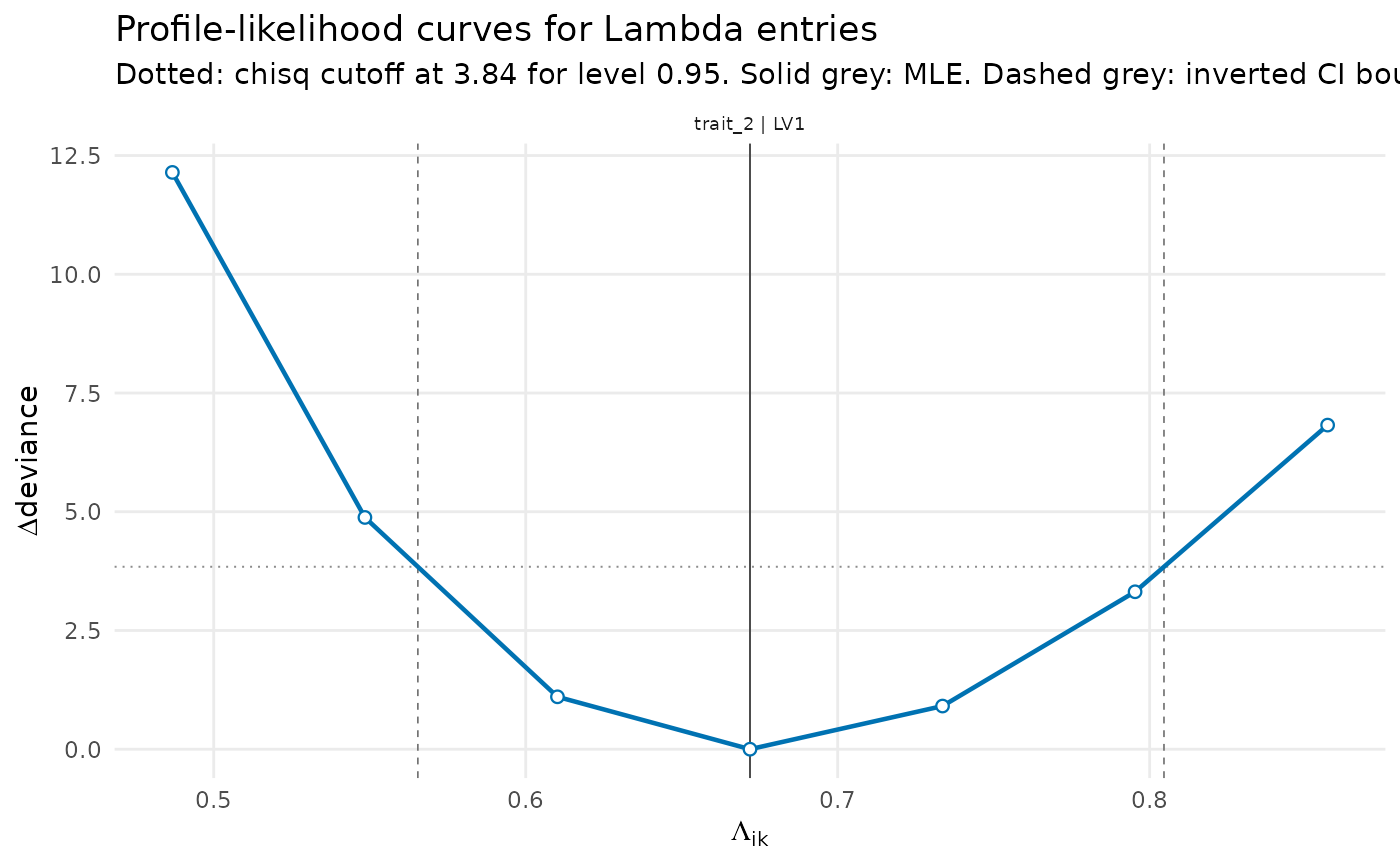
# Values whose delta_deviance stays below qchisq(0.95, 1) = 3.84 form
# the 95% profile interval. Compare with the Wald interval:
loading_ci(fit)[2, c("trait", "estimate", "lower", "upper")]
#>     trait  estimate     lower     upper
#> 2 trait_2 0.6718939 0.5509284 0.7928594

if (requireNamespace("ggplot2", quietly = TRUE)) {
  # The dip of the curve is the estimate; the dashed lines mark where it
  # crosses the dotted 3.84 line, i.e. the 95% profile interval.
  plot(pf)
}