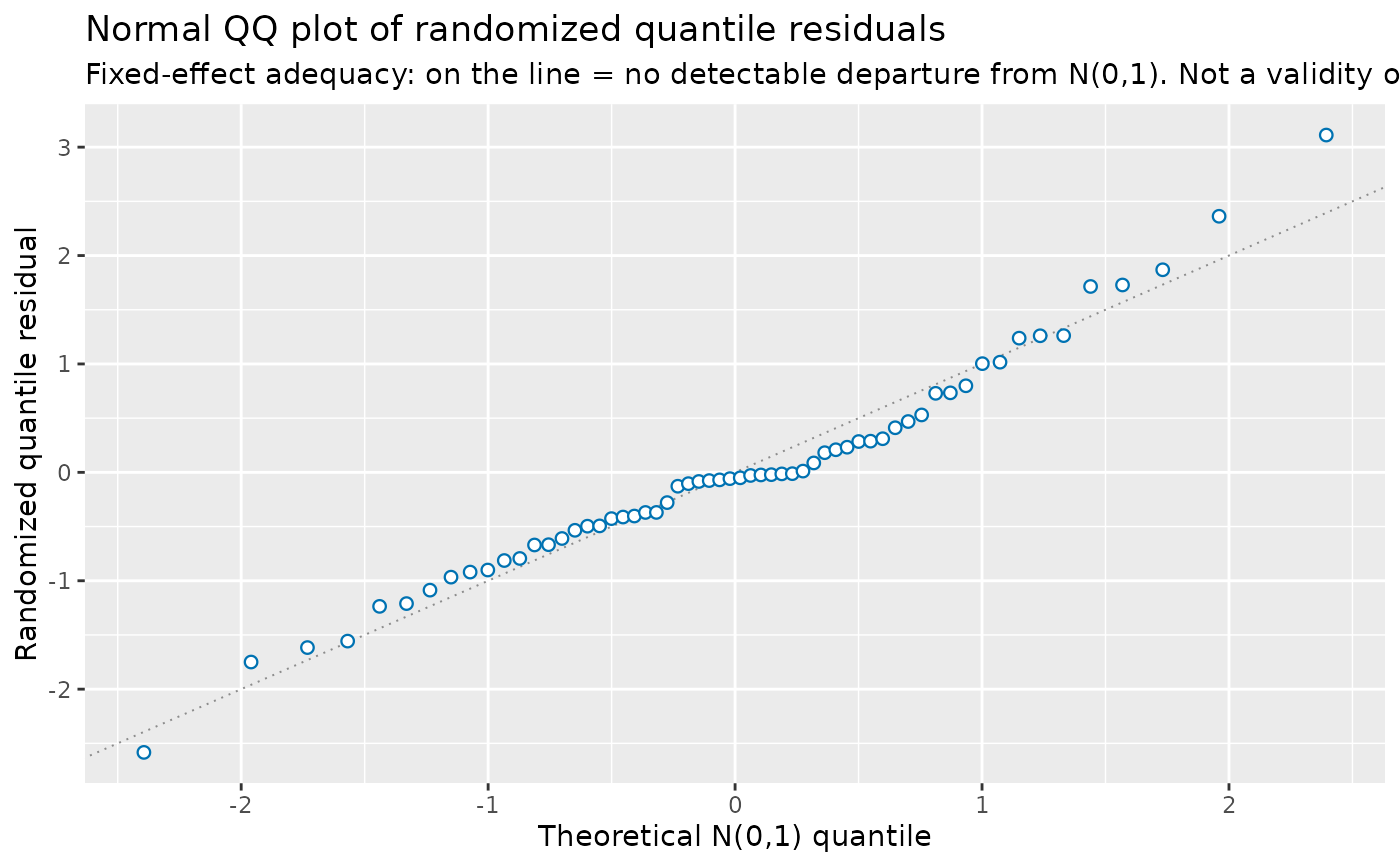
qq_plot() draws a normal QQ plot of drm_quantile_residuals() against
their N(0,1) order-statistic theoretical quantiles, with the y = x
reference line dotted. Points on the reference line are no detectable
departure from N(0,1); systematic curvature away from it flags a
mis-specification of the fitted distributional form.
Arguments
- object
A
drmTMBfit.- seed
Optional single integer seed, passed to
drm_quantile_residuals().- nsim
Number of Dunn-Smyth realizations to overplot as an envelope; passed to
drm_quantile_residuals().- response
For a bivariate
biv_gaussianfit,1or2, selecting which response's marginal residuals to plot; seefitted_distribution(). Must beNULL(the default) for univariate model types.- ...
Reserved for future options.
Details
When nsim > 1, a pale grey envelope (with a darker outline) overplots the
per-rank range across the nsim Dunn-Smyth realizations, so a single
randomized draw is not over-read; the first realization's points are drawn
on top.
This is fixed-effect adequacy only – see drm_quantile_residuals(). See
worm_plot() for the detrended variant that makes systematic bends easier
to read.
What this detects – and does not. Same scope as worm_plot() –
shape/atom mis-specification a family cannot reabsorb through its own
free parameters was detected with power >= 0.8 in the evaluated scenarios
(heavy tails, ignored
overdispersion or zero-inflation in a no-free-dispersion family, ignored
truncation, a missing zero/one atom); a mis-specification a free
nuisance/dispersion/inflation parameter absorbs (heteroscedasticity via
Student-t nu, missing zero-inflation via nbinom2 sigma, a
constant-vs-covariate inflation mechanism for hurdle_nbinom2/
zero_one_beta) is a genuine structural blind spot, not evidence of
adequacy; the same mechanism mis-spec for zi_poisson/zi_nbinom2 is
sample-size-limited rather than structurally blind but stays far below
0.8 even at n = 3000. See residuals.drmTMB()'s Details for the
numerical evidence and its incomplete Tweedie boundary.
Examples
set.seed(20260712)
n <- 60
x <- stats::rnorm(n)
dat <- data.frame(y = 0.5 + 0.8 * x + stats::rnorm(n), x = x)
fit <- drmTMB(bf(y ~ x, sigma ~ 1), family = gaussian(), data = dat)
if (requireNamespace("ggplot2", quietly = TRUE)) {
  qq_plot(fit)
}