
Complex distributional models sometimes need more care than the
default fit. This article gives a practical workflow for
drmTMB users when the optimizer does not converge,
gradients look large, TMB::sdreport() reports a
non-positive-definite Hessian, or Wald standard errors are unavailable.
It picks up where the check_drm() step in Checking
and using fitted models flags a problem.
The default optimizer settings are chosen for ordinary models to fit quickly and reproducibly. They are not meant to be the best possible settings for every large phylogenetic, spatial, bivariate, location-scale, shape, inflation, or random-slope model. For complex models, using a larger optimizer budget is a normal part of the workflow, not a sign that the model has failed.
The short version is: diagnose first, increase optimizer limits when the diagnostics point to an unfinished optimization, and simplify the model when the fitted surface is flat because a variance, correlation, shape, dispersion, or zero-inflation component is weakly identified.
Start with check_drm()
Always inspect the fitted object before interpreting a difficult model:
check_drm(fit)The diagnostic table separates several questions that are easy to confuse:
| Diagnostic | What it asks | First response when it warns |
|---|---|---|
optimizer_convergence |
Did the selected optimizer return convergence code 0? | Inspect the optimizer message, gradient, and budget rows. |
optimizer_budget |
Did the fit exhaust its optimizer budget? |
nlminb() uses
iter.max/eval.max; optim() uses
maxit and reports evaluation counts without iteration
counts. |
fixed_gradient |
Is the fixed-parameter gradient small at the selected optimum, and which component is largest? | Treat large gradients as an optimization problem before using Wald inference. |
hessian_positive_definite |
Did TMB::sdreport() report a positive-definite
Hessian? |
Look for boundary SDs, correlations, shape, dispersion, or inflation parameters. |
standard_errors_finite |
Are fixed-effect standard errors finite? | If not, do not use Wald intervals until the Hessian problem is understood. |
| boundary rows | Are fitted SDs, rho12, or shape parameters near a
boundary? |
Consider a simpler model, more groups, or a fixed/removal decision.
A profile interval is not a repair for a boundary: it
undercovers there too, and confint(method = "profile") now
warns when it returns one. |
A warning is not automatically a failed analysis. It is a prompt to decide whether the problem is unfinished optimization, weak identifiability, or an unnecessary model component.
The same table is often easier to read as a status map. The next
figure uses three small fitted examples: a Gaussian fit with default
settings, the same model run with drm_control(se = FALSE),
and a deliberately under-budgeted random-effect fit. The colours are
diagnostic statuses, not uncertainty intervals.
set.seed(20260523)
diagnostic_data <- data.frame(
  y = 0.5 + 0.7 * stats::rnorm(80) + stats::rnorm(80, sd = 0.35),
  x = stats::rnorm(80),
  z = stats::rnorm(80),
  id = factor(rep(seq_len(20), each = 4))
)

fit_clean <- drmTMB(
  bf(y ~ x, sigma ~ 1),
  data = diagnostic_data,
  family = gaussian()
)
fit_no_se <- drmTMB(
  bf(y ~ x, sigma ~ 1),
  data = diagnostic_data,
  family = gaussian(),
  control = drm_control(se = FALSE)
)
fit_low_budget <- drmTMB(
  bf(y ~ x + (1 | id), sigma ~ z),
  data = diagnostic_data,
  family = gaussian(),
  control = drm_control(
    optimizer = list(iter.max = 1, eval.max = 1)
  )
)

diagnostic_fits <- list(
  "Default budget" = fit_clean,
  "No standard errors\nse = FALSE" = fit_no_se,
  "Budget hit" = fit_low_budget
)
diagnostic_checks <- do.call(
  rbind,
  lapply(names(diagnostic_fits), function(fit_label) {
    checks <- as.data.frame(check_drm(diagnostic_fits[[fit_label]]))
    checks$fit <- fit_label
    checks
  })
)
diagnostic_rows <- c(
  "optimizer_convergence",
  "optimizer_budget",
  "finite_objective",
  "fixed_gradient",
  "sdreport_status",
  "hessian_positive_definite",
  "standard_errors_finite",
  "random_effect_sd_boundary"
)
diagnostic_row_labels <- c(
  "optimizer\nconvergence",
  "optimizer\nbudget",
  "finite\nobjective",
  "fixed\ngradient",
  "sdreport\nstatus",
  "positive-definite\nHessian",
  "finite\nSEs",
  "random-effect\nSD boundary"
)
diagnostic_grid <- expand.grid(
  check = diagnostic_rows,
  fit = names(diagnostic_fits),
  stringsAsFactors = FALSE
)
diagnostic_plot_data <- merge(
  diagnostic_grid,
  diagnostic_checks[, c("check", "fit", "status")],
  by = c("check", "fit"),
  all.x = TRUE,
  sort = FALSE
)
diagnostic_plot_data$status[is.na(diagnostic_plot_data$status)] <- "not applicable"
diagnostic_plot_data$status <- factor(
  diagnostic_plot_data$status,
  levels = c("ok", "note", "warning", "error", "not applicable")
)
diagnostic_plot_data$fit <- factor(
  diagnostic_plot_data$fit,
  levels = names(diagnostic_fits)
)
diagnostic_plot_data$check_label <- factor(
  diagnostic_row_labels[match(diagnostic_plot_data$check, diagnostic_rows)],
  levels = rev(diagnostic_row_labels)
)

ggplot2::ggplot(
  diagnostic_plot_data,
  ggplot2::aes(fit, check_label, fill = status)
) +
  ggplot2::geom_tile(colour = "white", linewidth = 0.8) +
  ggplot2::geom_text(
    ggplot2::aes(label = status),
    size = 3,
    colour = "grey12"
  ) +
  ggplot2::scale_fill_manual(
    values = c(
      "ok" = "#66C2A5",
      "note" = "#8DA0CB",
      "warning" = "#FC8D62",
      "error" = "#D53E4F",
      "not applicable" = "grey88"
    ),
    drop = FALSE
  ) +
  ggplot2::labs(
    title = "Read convergence as a diagnostic table, not a single flag",
    subtitle = "Notes and warnings tell different stories: skipped uncertainty is not failed optimization",
    x = NULL,
    y = NULL
  ) +
  theme_convergence() +
  ggplot2::theme(
    axis.text.x = ggplot2::element_text(face = "bold"),
    legend.position = "none"
  )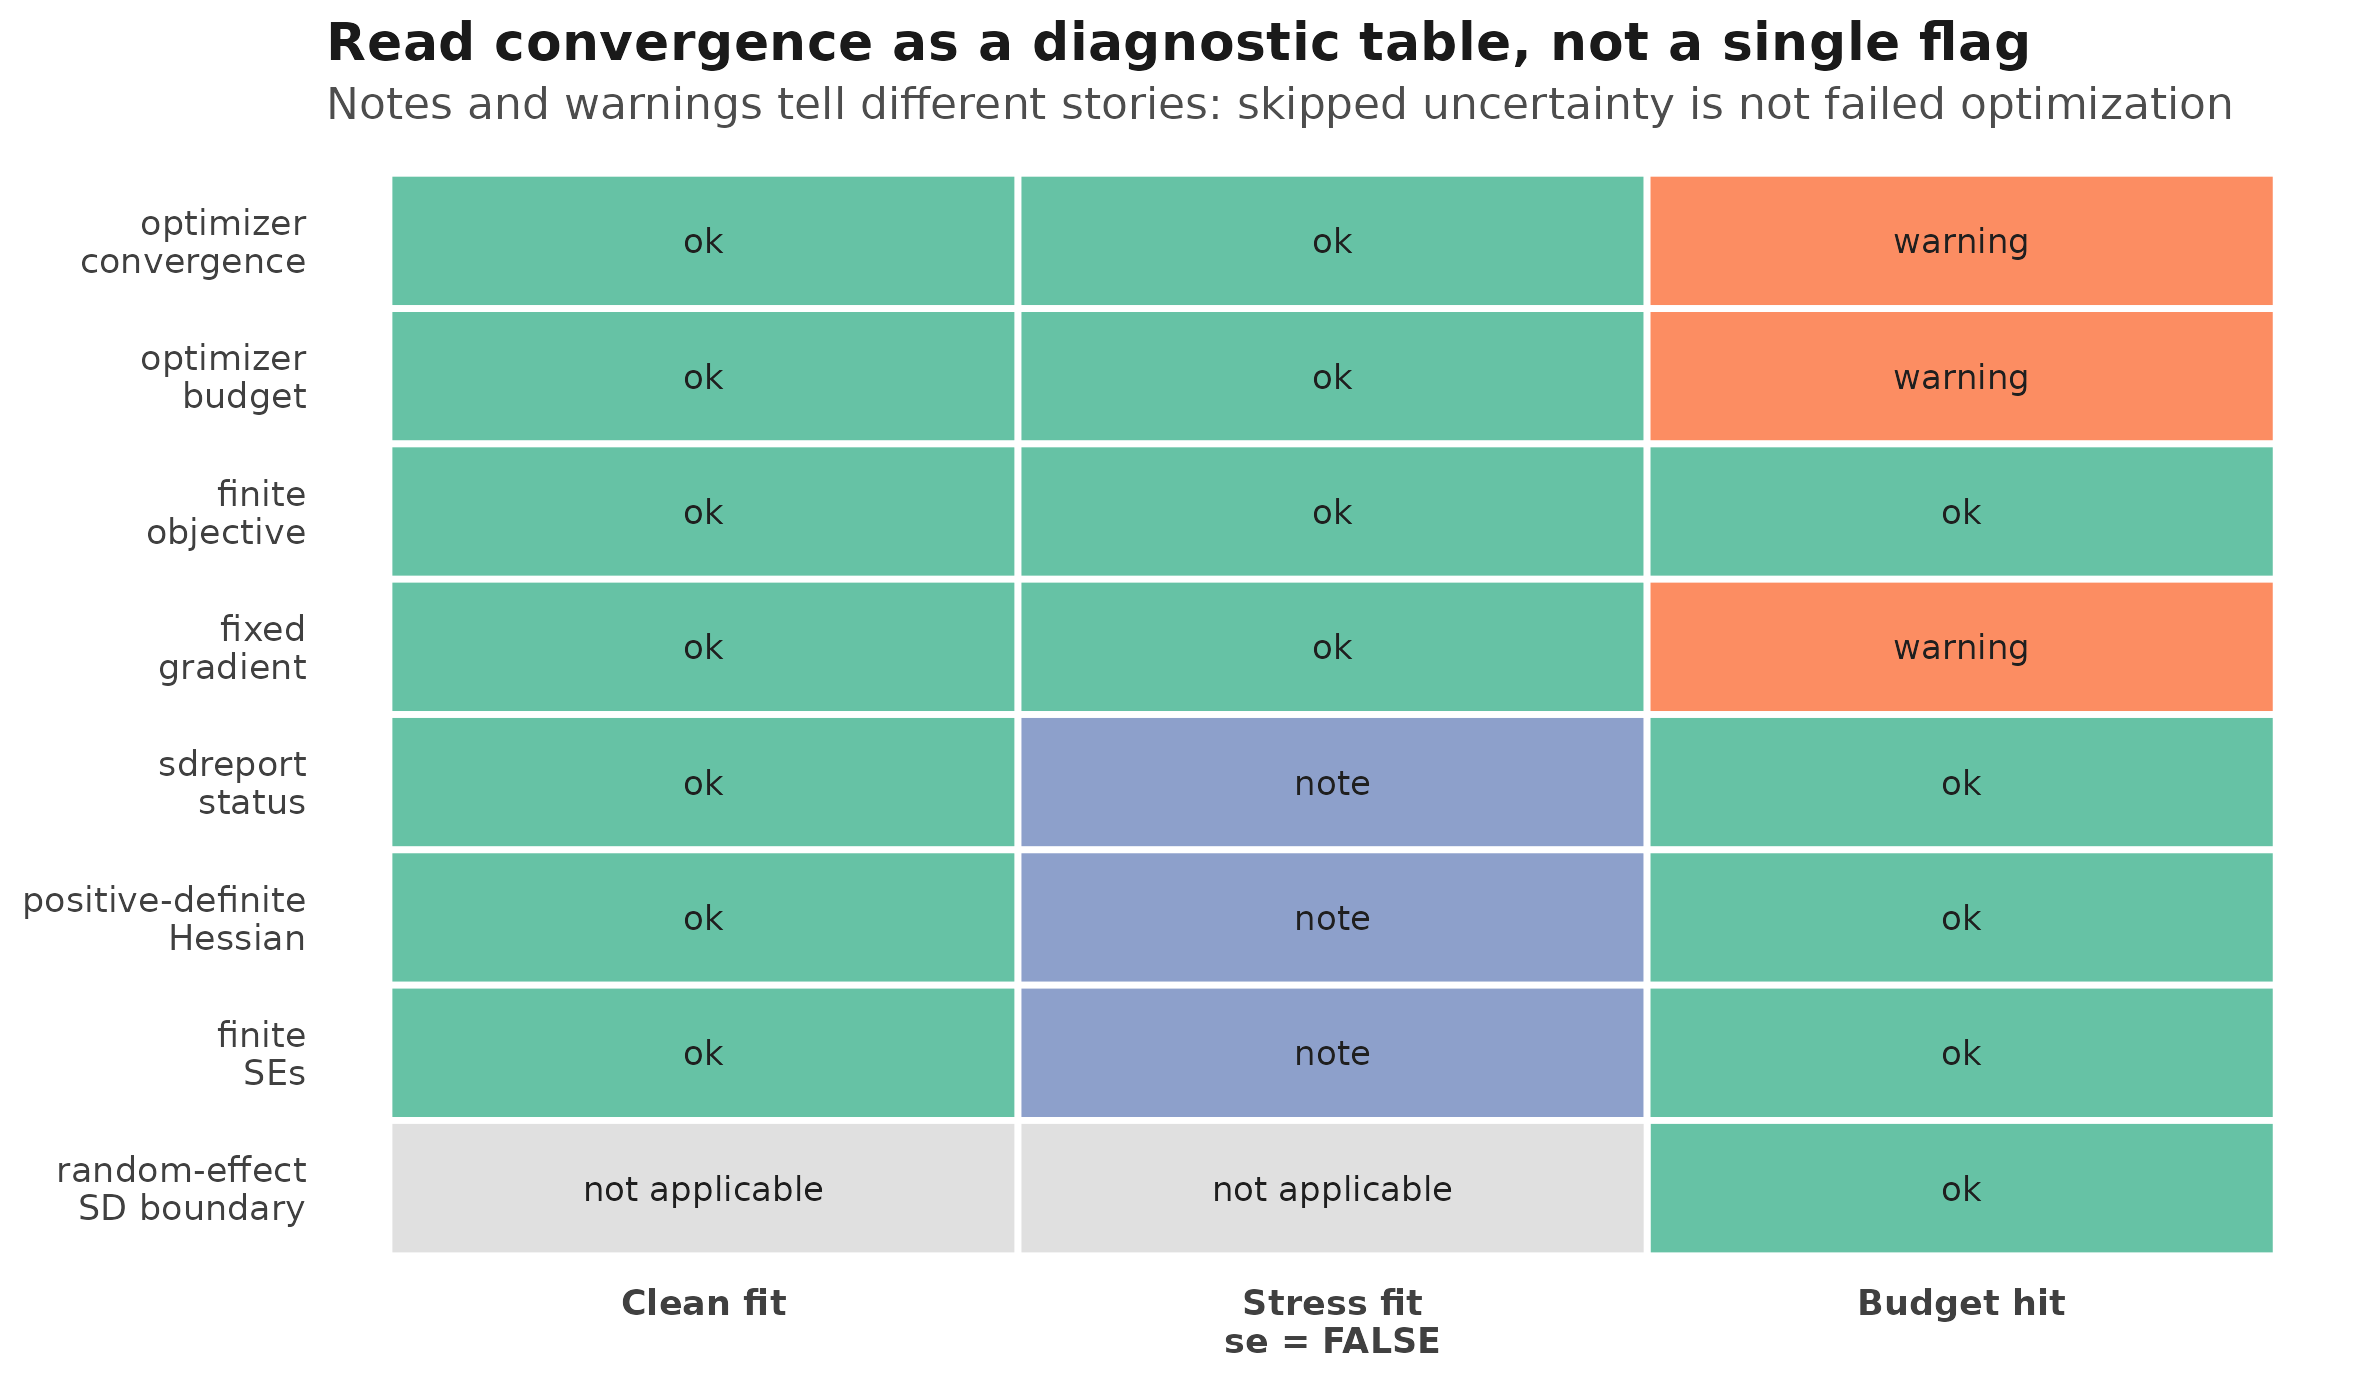
check_drm() status map for three tiny fitted examples.
Tiles show diagnostic statuses; they are not confidence intervals or
posterior probabilities.
Compare the budget and gradient checks
The table compares the same model and data under default and deliberately low optimizer limits. Both fits use the same explicit starting values, with Newton polishing disabled so a second optimization step cannot mask the budget limit. A function evaluation is one call to the objective function. The maximum absolute fixed gradient measures the largest local slope of that objective with respect to the fitted fixed parameters; a large value suggests that optimization is unfinished. Counts and gradients have different units and are shown in separate columns.
| Fit | Function evaluations | Maximum absolute gradient | Convergence code | Gradient check |
|---|---|---|---|---|
| Default budget | 34 | 0.000000004687 | 0 | ok |
| Low budget | 1 | 47.67 | 1 | warning |
Convergence code 0 means the optimizer reports convergence. The
default check_drm() gradient threshold is
0.001: a larger gradient gives a warning. The evaluation
count describes the work recorded for the selected optimizer attempt,
not a measure of fit quality or the total work across retry attempts. A
small gradient alone does not establish a global optimum, identifiable
parameters, or reliable standard errors. Check the Hessian and boundary
rows as well before interpreting uncertainty. This example changes the
optimizer budget; it does not compare BFGS with
nlminb().
Choose an optimizer directly
To check whether a difficult fit depends on the optimizer, fit the
same model with nlminb() and BFGS. Use identical public
starting values for this comparison and turn off Newton polishing to
compare the optimizers’ own results. This example reuses
dat from above:
comparison_model <- bf(y ~ x + (1 | id), sigma ~ z)
comparison_start <- list(`fixef:mu:(Intercept)` = 0)
fit_nlminb <- drmTMB(
  comparison_model, data = dat, family = gaussian(),
  control = drm_control(
    start = comparison_start, newton_polish = FALSE,
    optimizer = list(iter.max = 2000, eval.max = 4000)
  )
)
fit_bfgs <- drmTMB(
  comparison_model, data = dat, family = gaussian(),
  control = drm_control(
    optimizer_method = "BFGS", optimizer = list(maxit = 2000),
    start = comparison_start, newton_polish = FALSE
  )
)
logLik(fit_nlminb)
logLik(fit_bfgs)
check_drm(fit_bfgs)
optimizer_method also accepts "L-BFGS-B",
"Nelder-Mead", and "CG". These methods run
directly and use maxit = 1000 unless overridden.
L-BFGS-B uses factr and pgtol for
tolerances; the other methods accept reltol and
abstol. See ?drm_control for the control
contract. There is no public box-bound setting. Each method optimizes
the model’s internally transformed parameters.
Direct methods require the default optimizer_preset and
no fallback_optimizer. They reuse multi_start
and its parallel settings. Newton polishing remains enabled by default.
check_drm() names the method that ran and reports
convergence and budget status. Profile endpoint refits still use
nlminb() with separate controls; choosing BFGS for the fit
does not change that solver. These native choices are rejected by the
Julia engine, whose supported controls are documented in
?drm_control.
Compare objective values, fixed-parameter gradients, Hessians, and boundary checks together. Agreement between optimizers helps diagnose a missed optimum; it does not establish that variance components are identifiable or that standard errors are calibrated.
Use drm_control() for optimizer limits
drmTMB() uses stats::nlminb() by default.
The public way to pass optimizer settings is through
drm_control(optimizer = list(...)):
fit <- drmTMB(
  bf(y ~ x + (1 | id), sigma ~ z),
  data = dat,
  family = gaussian(),
  control = drm_control(
    optimizer = list(iter.max = 2000, eval.max = 2000)
  )
)
For the common case where you simply want a larger deterministic
nlminb() budget, use a named preset:
complex_control <- drm_control(
  optimizer_preset = "robust"
)
optimizer_preset = "careful" sets
iter.max = 1000 and eval.max = 1000.
optimizer_preset = "robust" sets both limits to 5000. The
default preset adds no optimizer controls, so ordinary models still use
the ordinary nlminb() defaults.
When the default deterministic nlminb() call raises an
optimizer error, for example a non-finite gradient evaluation on a
difficult tree topology, drmTMB() retries with
optimizer_preset = "careful" and then
"robust". The retry is deliberately narrow: it runs only
along the existing preset budgets and warns if a larger preset succeeds.
Use check_drm(fit) to inspect the documented diagnostic
status, value, and message for the final fit rather than relying on
implementation details of the optimizer record. If you pass explicit
optimizer controls, drmTMB() respects those controls
instead of silently replacing them with the preset ladder.
There is no universal best number. A small Gaussian fixed-effect
model should not need the same budget as a bivariate phylogenetic
location-scale model with random slopes and fitted correlations. Use
check_drm() to decide whether the extra budget changed the
result or merely gave the optimizer more time to reach the same
boundary.
For a model that reports a long iteration history, first check
whether the fit actually hit iter.max or
eval.max in check_drm(). If it did, rerun with
optimizer_preset = "careful" or "robust" and
compare estimates, gradients, and boundary rows with the original fit.
If the fitted SDs or correlations stay near a boundary after a larger
budget, simplify the random-effect or correlation structure before
treating the longer run as stronger evidence.
If a preset is almost right, combine it with explicit overrides:
fit <- drmTMB(
  bf(y ~ x + (1 | id), sigma ~ z),
  data = dat,
  control = drm_control(
    optimizer_preset = "robust",
    optimizer = list(eval.max = 8000)
  )
)
The fitted object records the expanded optimizer settings in
fit$control, so the analysis remains reproducible.
A plain list is still accepted for backward compatibility:
Prefer drm_control() in new code because it keeps
optimizer settings separate from drmTMB controls such as
se, keep_data, keep_model_frame,
keep_tmb_object, sparse_fixed, and
aggregate_gaussian.
Do not pass se = FALSE or storage controls inside
optimizer = list(...). Those names are not
nlminb() controls:
fit_fast <- drmTMB(
  bf(y ~ x + (1 | id), sigma ~ z),
  data = dat,
  control = drm_control(
    optimizer = list(iter.max = 2000, eval.max = 2000),
    se = FALSE
  )
)
Here se = FALSE skips TMB::sdreport() after
optimization. The fitted coefficients, log likelihood, fitted values,
residuals, predictions, simulations, and retained profile-likelihood
paths remain available, but Wald standard errors, vcov(),
and Wald confidence intervals are unavailable.
If the optimizer did not converge
When optimizer_convergence warns, read the message and
the other diagnostic rows. A useful escalation ladder is:
- Check the model formula and data. Confirm that each predictor has variation after missing-row removal, each grouping factor has enough levels and replication, and each transformed predictor is finite.
- Center and scale continuous predictors. This is especially important
for polynomial terms, interactions, phylogenetic or spatial terms, and
distributional parameters such as
sigma,nu, zero inflation, hurdle probability, orrho12. - Increase
iter.maxandeval.maxwhen the optimizer hit a supplied limit or stopped before the gradient was small. - Fit a simpler version of the model. For example, use
sigma ~ 1beforesigma ~ x, remove a weak random slope before fitting a full covariance block, or fitmurandom effects before adding scale, shape, inflation, or residual-correlation formulas. - Compare the estimates from the simpler and larger models. If the main scientific effect changes wildly, treat the larger model as unstable until simulation or profiling supports it.
Increasing optimizer limits is not a cure for a model that the data cannot identify. It is useful when the fit was still making progress, the gradient is not yet small, or a large model simply needed more evaluations.
If pdHess is false
pdHess = FALSE means the Hessian used by
TMB::sdreport() is not positive definite at the selected
optimum. In practice this often means the likelihood surface is nearly
flat in at least one direction.
Common causes are:
- a random-effect SD close to zero;
- a fitted correlation close to -1 or 1, including residual
rho12or a random-effect correlation; - a zero-inflation or hurdle component estimated near its boundary;
- dispersion or shape parameters that duplicate another source of variation;
- a scale model that is trying to explain the same pattern as a random effect;
- too many random slopes or covariance terms for the available replication;
- badly scaled predictors or responses.
First check whether the gradient is small. If the gradient is large,
the model has not been optimized well enough. If the gradient is small
but pdHess is false, the point estimates may still describe
the fitted optimum, but Wald standard errors and Wald confidence
intervals should not be treated as reliable.
In that second case, look for the culprit:
If one SD is effectively zero, that component may be unnecessary for
these data. If one correlation is close to -1 or 1, the covariance block
may be too rich. If sigma, nu, zero inflation,
hurdle, or one-inflation terms are extreme, the distributional parameter
may be duplicating another part of the model.
For inference on direct SD or correlation targets, use profile-likelihood intervals when the target is available:
profile_targets(fit)

summary(
  fit,
  conf.int = TRUE,
  method = "profile",
  ci_parm = "sd:mu:(1 | id)"
)
Profile intervals are not magic either: a flat profile is evidence that the parameter is weakly identified. But profiles show the shape of the likelihood more honestly than a Wald standard error near a boundary.
When bivariate phylogenetic correlations are near a boundary
Bivariate phylogenetic models can have more than one correlation layer. Keep these layers separate when reading diagnostics:
- residual
rho12is within-row response-response dependence after the fitted fixed, random, phylogenetic, or spatial components are accounted for; - a phylogenetic mean-mean correlation is latent structured covariance between the response-specific species effects;
- ordinary species or group correlations are non-phylogenetic random-effect covariance layers.
Near-boundary values in any of these layers are warnings, but they
are not the same warning. A residual rho12 close to
+/-1 says the remaining paired responses are almost
perfectly coupled. A phylogenetic mean-mean correlation close to
+/-1 says the fitted species effects have an almost
one-dimensional latent covariance. If both layers are present and one
moves to the boundary, the model may be trying to allocate the same
biological or measurement signal to more than one covariance
component.
A near-boundary phylogenetic correlation is often weakly
identified rather than genuinely close to +/-1. If one
response carries little phylogenetic signal, its phylogenetic SD is
pulled toward zero and the cross-correlation has nothing to correlate
against, so it drifts to the boundary along a nearly flat likelihood
ridge. The telltale sign is a large standard error on the
correlation despite a positive-definite Hessian
(pdHess = TRUE): check_drm() flags this as a
biv_phylo_mu_covariance warning and a
standard_errors_inflated note, and a likelihood profile of
the correlation is flat with no usable interval. A clean Hessian is
necessary, not sufficient. The fix is to drop the cross-correlation (fit
the two phylogenetic effects independently) or report it as
non-identified; the trait means and their standard errors are largely
unaffected.
For these fits, use a staged workflow:
- Fit a fixed/residual bivariate model and inspect
rho12. - Fit the simpler phylogenetic or ordinary group-level model that contains only the covariance layer you need first.
- Compare
check_drm()rows for optimizer convergence, fixed-gradient culprit,rho12_boundary, phylogenetic covariance diagnostics,standard_errors_inflated, and species replication. - Use
profile_targets()orcorpairs()only for targets whose interval status is reported as available. - Treat
se = FALSEruns as optimizer stress evidence only; they do not validate Hessian curvature, Wald standard errors, or Wald confidence intervals.
Larger data sets help when they add the right replication. More
species can help estimate a phylogenetic covariance layer, and more
independent repeated observations can help separate residual covariance
from species-level covariance. More rows alone do not guarantee a better
fit if the extra rows carry nearly the same paired response signal and
leave residual rho12 and structured covariance competing
for it.
drm_control(start = list(...)) accepts public parameter
labels, and multi_start adds reproducible perturbed starts.
fallback_optimizer can run an optim() method
after unsuccessful nlminb() attempts;
optimizer_method selects one directly. Copying a simpler
fit through start_from and supplying raw TMB maps remain
unsupported. Use the documented public labels when constructing starts
and inspect the selected fit’s diagnostics before using its
intervals.
Penalized / MAP estimation for weakly-identified phylogenetic components
When pdHess is false because a phylogenetic SD sits near
zero or a phylogenetic correlation pins at +/-1, and a
simpler model is not the answer you want, you can regularize the
weakly-identified component with an optional penalty (a
weakly-informative prior). This can turn a boundary-pinned,
non-positive-definite fit into a finite, positive-definite one:
fit_map <- drmTMB(
  bf(
    mu1    = y1 ~ x + phylo(1 | p | id, tree = tree),
    mu2    = y2 ~ x + phylo(1 | p | id, tree = tree),
    sigma1 = ~ x + phylo(1 | p | id, tree = tree),
    sigma2 = ~ x + phylo(1 | p | id, tree = tree),
    rho12  = ~ 1
  ),
  data = dat,
  family = biv_gaussian(),
  penalty = drm_phylo_penalty(sd_u = 1, sd_alpha = 0.05, cor_sd = 0.5)
)
drm_phylo_penalty() puts a penalised-complexity prior on
each phylogenetic SD (sd_u, sd_alpha: a priori
P(sd > sd_u) = sd_alpha) and, when cor_sd
is set, a mean-zero normal N(0, cor_sd) on the
unconstrained (transformed, atanh-scale) phylogenetic correlation
parameter. The correlation penalty is the part that pulls a coupled
correlation off the +/-1 boundary.
This switches the estimator from maximum likelihood to penalized / maximum-a-posteriori (MAP), and that distinction matters:
- The fit is labeled
estimator = "MAP"andcheck_drm()adds apenalized_mapnote. It is a regularized point estimate, not an ML fit. -
logLik()returns the unpenalized data log-likelihood (the penalty is stored infit$phylo_penalty), so it stays comparable on the data scale – but likelihood-ratio tests and AIC across penalized fits are not standard. - The penalty makes a model fittable; it does not make a weakly-identified component identified. Where the data are nearly uninformative, the estimate reflects the prior.
Because of that last point, there is no universal penalty
strength: a cor_sd that is right for one dataset
is wrong for another, because it trades off against the unknown true
correlation magnitude. Always run a prior-sensitivity sweep and
interpret only the quantities that are stable across it:
sweep <- lapply(c(0.25, 0.5, 1.0), function(s) {
  f <- drmTMB(
    form,
    data = dat, family = biv_gaussian(),
    penalty = drm_phylo_penalty(sd_u = 1, sd_alpha = 0.05, cor_sd = s)
  )
  pairs <- corpairs(f, level = "phylogenetic")
  stopifnot(nrow(pairs) > 0L)
  pairs
})
If a correlation barely moves as you tighten the prior, it is data-informed; if it tracks the prior, it is prior-dominated and should be reported as such (or not interpreted). For a definitive, prior-free result on a coupled phylogenetic location-scale model, the clean route is within-group replication (more than one observation per species), which identifies the full model from the data itself.
Treat the penalty as a complement to – not a replacement for – simplifying the model, collecting replicated data, or fitting the same model in a Bayesian framework where the prior is explicit.
Choosing between maximum likelihood and REML
drmTMB fits by maximum likelihood
(REML = FALSE) by default. Restricted maximum likelihood
(REML = TRUE) is available across a bounded Gaussian
surface, including phylogenetic models. A diagnostic-only binomial slice
also accepts one ordinary unlabelled location (mu) random
intercept or independent slope. Fixed-only, multiple-term, correlated,
labelled, structured, and missing-response binomial REML models remain
unavailable.
Why: maximum likelihood estimates a variance component as if the
fixed effects were known, which biases the variance downward by
a factor of order p / n (p fixed effects,
n groups; for a phylogenetic effect n is the
number of tips). REML accounts for the degrees of freedom spent on the
fixed effects and removes that leading bias. The correction is set by
the ratio p / n, not by n alone: a
rich fixed-effect surface – several mean covariates plus an
sd_phylo(...) ~ x surface, which all count toward
p – can leave a noticeable correction even at a few hundred
tips. On the standard-deviation scale the correction is about half the
size of the variance correction (roughly p / 2n, by the
delta method), which is why the SD movements below are modest. As
p / n shrinks toward zero the two estimators converge.
What actually moves: for a Gaussian location-scale model the mean and
the variance are information-orthogonal, so switching ML to REML leaves
the mean-model coefficients essentially unchanged and
adjusts the variance-component estimates – the
phylogenetic SD and, for an sd_phylo(...) ~ x surface, its
coefficients. In a 16-species fit the mean coefficients moved by under
0.005 while the sd_phylo intercept and slope moved by about
0.04 to 0.06; by a few hundred species even the SD difference is
negligible.
Practical guidance:
-
Small
p / n– hundreds of tips or more against a modest number of fixed effects (a large clade, or a dataset in the thousands of tips): use the default ML. The correction is a fraction of a percent and does not change the conclusions. At Ayumi Mizuno’s ~10,440-tip scale it is about 0.05%. -
Large
p / n– tens of species, or a small subclade carrying a rich fixed-effect surface: preferREML = TRUE. This is where ML’s downward variance bias is largest and REML earns its keep. -
If you interpret a variance component, fit both and
compare. If the phylogenetic SD or the
sd_phylo ~ xcoefficients move materially between ML and REML, report that sensitivity; if they barely move, the estimate is robust to the choice.
fit_ml <- drmTMB(form, data = dat, family = gaussian()) # default (ML)
fit_reml <- drmTMB(form, data = dat, family = gaussian(), REML = TRUE)
# Compare the variance-component estimates; the mean coefficients should agree.
A Gaussian REML fit is labeled estimator = "REML" and
goes through the same check_drm(), profile, and
standard-error diagnostics as an ML fit; REML does not change how you
read them.
For a binomial model, use REML = FALSE for scientific
reporting. In the tested ordinary-intercept and independent-slope
examples, the available binomial REML calculation agreed with
glmmTMB(REML = TRUE) and returned finite uncertainty. That
is a narrow diagnostic check, not evidence that the estimator recovers
parameters well or that its intervals have reliable coverage. A separate
cumulative-logit fitting method is not available through
drmTMB(); it does not justify reporting an interval from a
public ordinal fit.
Separate optimization from uncertainty
For very large or opt-in-control fits, it can be useful to separate “can the model optimize?” from “can Wald uncertainty be computed?”:
fit_no_se <- drmTMB(
  bf(y ~ x + (1 | id), sigma ~ z),
  data = dat,
  control = drm_control(
    optimizer = list(iter.max = 2000, eval.max = 2000),
    se = FALSE
  )
)

check_drm(fit_no_se)
This fit skips TMB::sdreport(), so Hessian and finite-SE
rows are reported as notes. Use this mode for exploratory optimization,
prediction, simulation, and large-data stress tests. Refit with
se = TRUE when Wald standard errors or Wald confidence
intervals are part of the final report:
fit_final <- drmTMB(
  bf(y ~ x + (1 | id), sigma ~ z),
  data = dat,
  control = drm_control(
    optimizer = list(iter.max = 2000, eval.max = 2000),
    se = TRUE
  )
)
For memory-heavy objects, keep the TMB object in the final fit if you need gradient diagnostics or profile intervals:
fit_final <- drmTMB(
  bf(y ~ x + (1 | id), sigma ~ z),
  data = dat,
  control = drm_control(
    optimizer = list(iter.max = 2000, eval.max = 2000),
    keep_tmb_object = TRUE
  )
)
Model-specific advice
For ordinary Gaussian location random effects, start with the
location model. Add arbitrary correlated mu slopes only
when groups have enough replication to estimate the covariance block. A
model such as (1 + x1 + x2 | id) is statistically hungrier
than three independent SD terms.
For Gaussian scale models, remember that sigma is a
residual standard deviation model. Scale random effects and scale random
slopes can be difficult to separate from location random effects,
residual heteroscedasticity, and outliers. Use enough groups and
repeated observations, and check boundary SDs before interpreting a
scale component.
For bivariate models, keep residual rho12, group-level
correlations, phylogenetic or spatial correlations, and known sampling
covariance V separate. A warning in one correlation layer
does not mean the others are the same problem.
For non-Gaussian models, add complexity in this order: fixed-effect
mu, fixed-effect scale or shape if implemented for that
family, ordinary mu random effects, then scale, shape,
inflation, hurdle, one-inflation, structured dependence, or
cross-parameter covariance only after each simpler layer is stable.
Non-Gaussian shape and inflation formulas can look like extra variance
components when data are sparse.
For meta_V(V = V) models, check the scale and
conditioning of the known sampling covariance. A diagonal known variance
vector and a dense known covariance matrix are both accepted inputs, but
a poorly conditioned dense V can make the likelihood
numerically harder even when the model formula is simple.
What is planned but not automatic yet
Several convergence tools are deliberately not automatic in the current release:
- user-supplied named starts;
- warm-start refits from a simpler fitted model; names such as
start_from,warm_start, andwarm_start_fromare reserved until the source-fit contract is implemented; - fallback optimizers such as
optim(method = "BFGS")oroptim(method = "L-BFGS-B"); names such asfallback_optimizer,fallback_optimizers, andoptimizer_fallbackare reserved until optimizer comparison provenance is implemented; - multi-start jittered searches;
- Hessian eigenvector culprit reporting;
- automatic simplification suggestions.
The current design records these as future controls rather than
silently trying many optimizers behind the user’s back. The automatic
nlminb() preset retry above is a narrower error-recovery
path, not an alternative-optimizer search. For reproducible science, a
fitted object must record which optimizer, start, objective value,
gradient, and selected optimum produced the reported estimates.
Further reading
The practical recommendations here follow the same broad logic used by related mixed-model software:
- the
metafornote on convergence problems inrma.mv(), which shows why boundary variance components can makenlminb()sensitive to iteration and tolerance settings; - the
glmmTMBtroubleshooting vignette, especially its discussion of non-positive-definite Hessians, extreme parameters, and flat likelihood directions; - the
lme4convergence guidance, which recommends scaling predictors, restarting from the reported optimum, and comparing optimizers when warnings are hard to interpret; - the
TMB::sdreport()documentation, which explains why Wald standard errors depend on the fitted-parameter Hessian.
Working in Julia? The DRModels.jl
companion page mirrors this article with Julia syntax and states
which parts DRModels.jl supports today. DRModels.jl is a separate
package with its own fitting and inference routes; Julia is optional for
drmTMB users.