
When group variation changes with a predictor
Source:vignettes/predictor-dependent-random-sd.Rmd
predictor-dependent-random-sd.RmdThis guide shows how to ask whether groups differ in their typical
spread, and whether that spread changes with a group-level predictor. It
starts with synthetic Bernoulli and Poisson data, then uses a Gamma
model for positive responses from related groups. The data-generating
values are known. The Bernoulli and Poisson models estimate a
random-intercept standard deviation; they do not estimate a separate
residual sigma. The Gamma example separates its conditional
response spread from the scale of its latent group effects.
The model
For a binary response, the group effect shifts the log odds:
\[ \begin{aligned} Y_{ig} \mid b_g &\sim \operatorname{Bernoulli}(p_{ig}), \\ \operatorname{logit}(p_{ig}) &= \beta_0 + \beta_1 x_{ig} + b_g, \\ b_g &\sim \operatorname{Normal}(0, s_g^2), \\ \log(s_g) &= \alpha_0 + \alpha_1 w_g. \end{aligned} \]
For counts, the same random effect shifts the log expected count:
\[ \begin{aligned} Y_{ig} \mid b_g &\sim \operatorname{Poisson}(\mu_{ig}), \\ \log(\mu_{ig}) &= \beta_0 + \beta_1 x_{ig} + b_g, \\ b_g &\sim \operatorname{Normal}(0, s_g^2), \\ \log(s_g) &= \alpha_0 + \alpha_1 w_g. \end{aligned} \]
Here, x varies among observations and w is
constant within each group. The fixed-effect coefficient for
x describes a change in the mean predictor. The coefficient
alpha_1 describes how the spread of group effects changes:
because the log link is used for s_g, a one-unit increase
in w multiplies the random-intercept SD by
exp(alpha_1). It does not multiply the variance by that
amount; the variance ratio is exp(2 * alpha_1).
The R formula keeps those questions separate. For example,
y ~ x + (1 | group) models the response predictor, while
sd(group) ~ w models the SD of the latent group intercept.
The group-level predictor must have one value per group; a within-group
predictor belongs in the mean formula in this scalar-intercept example.
More general random- regression models can use within-group predictors
to define random slopes; that is a different model structure from the
intercept-only examples here.
Make two small synthetic data sets
The examples use 60 groups with 10 observations per group. The two
values of w differ by one unit, so exponentiating its
fitted coefficient gives the high-w to low-w
random-intercept SD ratio.
set.seed(20261017)
n_group <- 60L
n_per_group <- 10L
group_info <- data.frame(
  group = factor(seq_len(n_group)),
  w = rep(c(-0.5, 0.5), each = n_group / 2)
)
group_index <- rep(seq_len(n_group), each = n_per_group)

bernoulli_data <- group_info[group_index, , drop = FALSE]
bernoulli_data$x <- stats::rnorm(nrow(bernoulli_data))
bernoulli_b <- exp(-0.4 + 0.45 * group_info$w) *
  stats::rnorm(n_group)
bernoulli_data$y <- stats::rbinom(
  nrow(bernoulli_data),
  size = 1,
  prob = stats::plogis(
    -0.25 + 0.5 * bernoulli_data$x + bernoulli_b[group_index]
  )
)

poisson_data <- group_info[group_index, , drop = FALSE]
poisson_data$x <- stats::rnorm(nrow(poisson_data))
poisson_b <- exp(-0.4 + 0.45 * group_info$w) *
  stats::rnorm(n_group)
poisson_data$y <- stats::rpois(
  nrow(poisson_data),
  lambda = exp(-0.2 + 0.3 * poisson_data$x + poisson_b[group_index])
)
Each data set has a binary group-level predictor and an
observation-level predictor. The latent effects are generated with an SD
that increases with w. The response-specific intercept and
slope values differ between the two examples, so the Bernoulli and
Poisson fits are independent illustrations.
Fit a Bernoulli model
The Bernoulli likelihood has no free residual sigma. The
fitted random intercept is on the logit scale, and
sd(group) ~ w describes its group-level standard deviation
on that same latent scale.
fit_bernoulli <- drmTMB(
  bf(y ~ x + (1 | group), sd(group) ~ w),
  family = stats::binomial(link = "logit"),
  data = bernoulli_data
)

bernoulli_checks <- check_drm(fit_bernoulli)
data.frame(check = bernoulli_checks$check, status = bernoulli_checks$status)
#>                           check status
#> 1         optimizer_convergence     ok
#> 2            convergence_status     ok
#> 3              optimizer_budget     ok
#> 4              finite_objective     ok
#> 5         logsigma_clamp_active     ok
#> 6                fixed_gradient     ok
#> 7               sdreport_status     ok
#> 8     hessian_positive_definite     ok
#> 9          hessian_conditioning     ok
#> 10       standard_errors_finite     ok
#> 11     standard_errors_inflated     ok
#> 12                mle_existence     ok
#> 13   observations_per_parameter     ok
#> 14                 dropped_rows     ok
#> 15               positive_scale     ok
#> 16    random_effect_sd_boundary     ok
#> 17   interval_reliability_scope   note
#> 18            residual_outliers     ok
#> 19     fixed_effect_design_size     ok
#> 20 mu_random_effect_replication     ok
coef(fit_bernoulli, "sd(group)")
#> (Intercept)           w
#>  -0.6826388   0.4745828
exp(coef(fit_bernoulli, "sd(group)")["w"])
#>        w
#> 1.607343
The final value is the estimated ratio of random-intercept SDs
between the two w groups. It is not a ratio of event
probabilities. Compare it with the known ratio from the data-generating
model, exp(0.45), as a check that the example behaves as
intended; a single generated data set need not recover the truth
exactly.
Fit a Poisson model
In the Poisson model, the latent intercept is on the log-mean scale.
The Poisson sampling distribution already determines the
observation-level variance from its mean; sd(group)
describes additional variation among group-specific log means.
fit_poisson <- drmTMB(
  bf(y ~ x + (1 | group), sd(group) ~ w),
  family = stats::poisson(link = "log"),
  data = poisson_data
)

poisson_checks <- check_drm(fit_poisson)
data.frame(check = poisson_checks$check, status = poisson_checks$status)
#>                         check status
#> 1       optimizer_convergence     ok
#> 2          convergence_status     ok
#> 3            optimizer_budget     ok
#> 4            finite_objective     ok
#> 5       logsigma_clamp_active     ok
#> 6              fixed_gradient     ok
#> 7             sdreport_status     ok
#> 8   hessian_positive_definite     ok
#> 9        hessian_conditioning     ok
#> 10     standard_errors_finite     ok
#> 11   standard_errors_inflated     ok
#> 12              mle_existence     ok
#> 13 observations_per_parameter     ok
#> 14               dropped_rows     ok
#> 15             positive_scale     ok
#> 16  random_effect_sd_boundary     ok
#> 17 interval_reliability_scope   note
#> 18          residual_outliers     ok
#> 19   fixed_effect_design_size     ok
coef(fit_poisson, "sd(group)")
#> (Intercept)           w
#>  -0.5027392   0.8930412
exp(coef(fit_poisson, "sd(group)")["w"])
#>        w
#> 2.442547
This ratio also targets the change in random-intercept SD between the
two values of w. It does not describe a change in Poisson
residual dispersion.
The fixed seed gives these particular estimates. The table keeps their departure from the known ratio visible; it is not a parameter-recovery or calibration result.
| Response | True high/low SD ratio | Estimated ratio in this draw |
|---|---|---|
| Bernoulli | 1.568 | 1.607 |
| Poisson | 1.568 | 2.443 |
Predict the group-level standard deviations
With no newdata, predict() returns one
predicted SD for each fitted group. type = "link" returns
the log SD; type = "response" returns the SD after
exponentiation. These are model-implied group-level scales, not the
fitted conditional random intercepts themselves.
bernoulli_log_sd <- predict(
  fit_bernoulli, dpar = "sd(group)", type = "link"
)
bernoulli_sd <- predict(
  fit_bernoulli, dpar = "sd(group)", type = "response"
)
bernoulli_sd_table <- data.frame(
  group = names(bernoulli_sd),
  log_sd = unname(bernoulli_log_sd),
  sd = unname(bernoulli_sd)
)
bernoulli_sd_table$w <- group_info$w[
  match(bernoulli_sd_table$group, as.character(group_info$group))
]
head(bernoulli_sd_table)
#>   group     log_sd        sd    w
#> 1     1 -0.9199302 0.3985469 -0.5
#> 2     2 -0.9199302 0.3985469 -0.5
#> 3     3 -0.9199302 0.3985469 -0.5
#> 4     4 -0.9199302 0.3985469 -0.5
#> 5     5 -0.9199302 0.3985469 -0.5
#> 6     6 -0.9199302 0.3985469 -0.5

poisson_sd <- predict(fit_poisson, dpar = "sd(group)")
head(data.frame(group = names(poisson_sd), sd = unname(poisson_sd)))
#>   group        sd
#> 1     1 0.3870274
#> 2     2 0.3870274
#> 3     3 0.3870274
#> 4     4 0.3870274
#> 5     5 0.3870274
#> 6     6 0.3870274
The default response-scale predictions are positive SDs. The
w coefficient summarises their systematic change; the
group-level values also reflect the observed design matrix and should
not be read as one estimate of the realised random effect in each
group.
Three kinds of spread
For a Gaussian response, residual sigma is an
observation-level standard deviation around the conditional mean. A
model for sigma answers a different question from a model
for the SD of a latent group effect. See the location-scale tutorial for a Gaussian
example that models residual spread.
For a Gamma response, sigma is a conditional coefficient
of variation: the conditional response SD is mu * sigma. A
random intercept in the log-mean predictor describes variation among
group-specific log means. Its SD is on the log-mean scale, rather than
the original response scale.
Related groups: multiplier and marginal SD
A supplied matrix K lets latent group effects covary.
Write
\[ \begin{aligned} u &\sim \operatorname{Normal}(0,K), \\ b &= D_su, \\ D_s &= \operatorname{diag}(s_1,\ldots,s_G), \\ \log s_g &= \alpha_0+\alpha_1z_g. \end{aligned} \]
Then Cov(b) = D_s K D_s, and the marginal SD of the
group effect is
\[ \operatorname{SD}(b_g)=s_g\sqrt{K_{gg}}. \]
Here, marginal means averaging over the latent field, rather than
conditioning on its fitted value. The predicted s_g is an
SD multiplier. It equals the marginal SD when the corresponding diagonal
entry of K is one. Keep the supplied matrix scale visible
when interpreting predictions.
A one-unit increase in z multiplies s_g by
exp(alpha_1) and its squared multiplier by
exp(2 * alpha_1). Comparing groups with different diagonal
entries also puts sqrt(K_hh / K_ll) into their marginal SD
ratio. Neither ratio describes a change in the response mean.
A continuous predictor for related groups
Suppose repeated positive measurements, such as plant growth, come
from related populations. This synthetic Gamma model asks whether the
spread of population effects changes along a continuous environmental
predictor z. The observation-level predictor x
changes the conditional mean.
\[ \begin{aligned} Y_{ig}\mid b_g &\sim \operatorname{Gamma}(\text{shape},\text{rate}), \\ \text{shape} &= 1/\sigma^2, \\ \text{rate} &= 1/(\sigma^2\mu_{ig}), \\ \log\mu_{ig} &= 0.4+0.3x_{ig}+b_g, \\ \log s_g &= \log(0.55)+0.4z_g. \end{aligned} \]
The matrix has a non-unit diagonal. Its row names identify groups, while the observations are shuffled so that matrix order and observation order differ.
set.seed(20261104)
G <- 40L
ids <- paste0("g", seq_len(G))
z <- setNames(seq(-1, 1, length.out = G), ids)
k_scale <- setNames(seq(0.7, 1.6, length.out = G), ids)
R <- outer(seq_len(G), seq_len(G), function(i, j) 0.35^abs(i - j))
K <- outer(k_scale, k_scale) * R
dimnames(K) <- list(ids, ids)
s <- exp(log(0.55) + 0.4 * z)
b <- setNames(s * as.vector(t(chol(K)) %*% rnorm(G)), ids)
index <- sample(rep(seq_len(G), each = 12L))
gamma_data <- data.frame(
  id = factor(ids[index], levels = ids),
  z = unname(z[index]), x = rnorm(length(index))
)
mu <- exp(0.4 + 0.3 * gamma_data$x + b[as.character(gamma_data$id)])
gamma_data$y <- rgamma(nrow(gamma_data), shape = 4, rate = 4 / mu)
Fit maximum likelihood with the native TMB engine’s Laplace
approximation. The residual coefficient of variation is constant, while
the latent SD multiplier depends on z. This example
requests point estimates only.
gamma_formula <- bf(
  y ~ x + relmat(1 | id, K = K), sigma ~ 1,
  sd(id, level = "relmat") ~ z
)
fit_gamma <- drmTMB(
  gamma_formula, family = stats::Gamma(link = "log"), data = gamma_data,
  engine = "tmb", REML = FALSE, control = drm_control(se = FALSE)
)
gamma_alpha <- coef(fit_gamma, dpar = "sd_relmat(id)")
knitr::kable(data.frame(
  Quantity = "SD multiplier ratio for a one-unit increase in z",
  Truth = exp(0.4), Estimate = exp(gamma_alpha[["z"]])
), digits = 3)| Quantity | Truth | Estimate |
|---|---|---|
| SD multiplier ratio for a one-unit increase in z | 1.492 | 1.073 |
The estimate in this draw is much closer to one than the generating ratio, despite the repeated observations within each group. One successful fit does not establish parameter recovery across other draws or designs.
The group predictions let us keep the matrix contribution separate:
gamma_s_hat <- predict(fit_gamma, dpar = "sd_relmat(id)")
gamma_scales <- data.frame(
  id = names(gamma_s_hat),
  z = unname(z[names(gamma_s_hat)]),
  multiplier = unname(gamma_s_hat),
  marginal_sd = unname(gamma_s_hat * sqrt(diag(K)[names(gamma_s_hat)])),
  true_multiplier = unname(s[names(gamma_s_hat)]),
  true_marginal_sd = unname(s[names(gamma_s_hat)] *
                            sqrt(diag(K)[names(gamma_s_hat)]))
)
gamma_scales <- gamma_scales[order(gamma_scales$z), ]
head(gamma_scales)
#>   id          z multiplier marginal_sd true_multiplier true_marginal_sd
#> 1 g1 -1.0000000  0.5576818   0.3903772       0.3686760        0.2580732
#> 2 g2 -0.9487179  0.5596997   0.4047059       0.3763167        0.2721059
#> 3 g3 -0.8974359  0.5617249   0.4191332       0.3841157        0.2866094
#> 4 g4 -0.8461538  0.5637574   0.4336595       0.3920764        0.3015972
#> 5 g5 -0.7948718  0.5657973   0.4482855       0.4002021        0.3170832
#> 6 g6 -0.7435897  0.5678445   0.4630117       0.4084961        0.3330814
local({
  old_par <- graphics::par(mfrow = c(1, 2), mar = c(4, 4, 2, 1))
  on.exit(graphics::par(old_par))
  limits <- range(gamma_scales[c(
    "multiplier", "marginal_sd", "true_multiplier", "true_marginal_sd"
  )])
  for (quantity in c("multiplier", "marginal_sd")) {
    label <- if (quantity == "multiplier") "SD multiplier" else "Marginal group-effect SD"
    graphics::plot(gamma_scales$z, gamma_scales[[quantity]],
      type = "b", pch = 21, bg = "white", col = "#0072B2", cex = 0.65,
      xlab = "Group predictor z", ylab = "Scale on the log-mean predictor",
      main = label, ylim = limits
    )
    graphics::lines(gamma_scales$z, gamma_scales[[paste0("true_", quantity)]],
      col = "#D55E00", lty = 2, lwd = 2)
    graphics::legend("topleft", legend = c("Fitted", "Generating"),
      col = c("#0072B2", "#D55E00"), lty = c(1, 2), bty = "n", cex = 0.8)
  }
})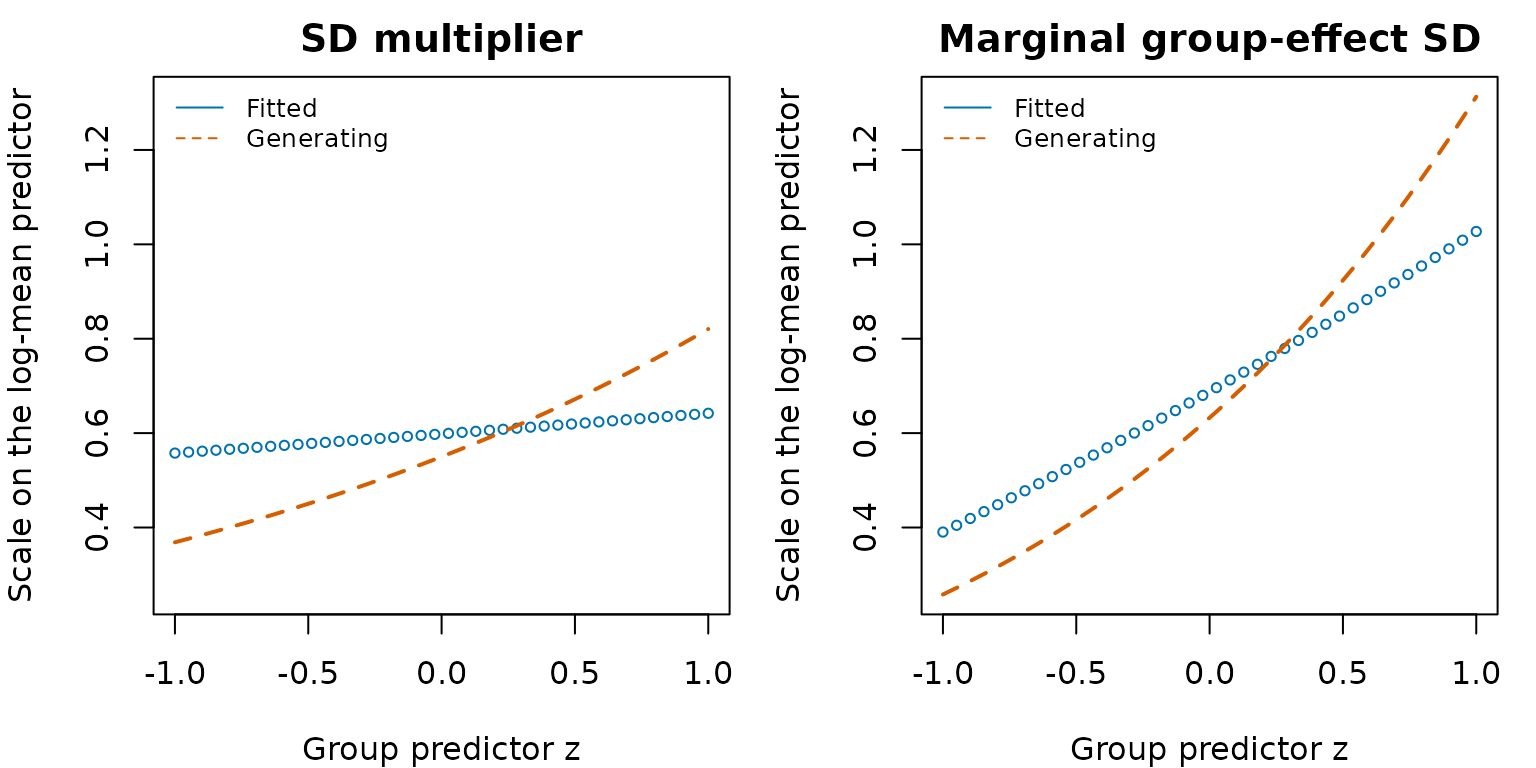
Latent group-effect scales in one synthetic Gamma data set. Circles mark model-implied values for the 40 fitted groups. Solid blue lines connect fitted values; dashed orange lines show the generating values. The left panel shows the SD multiplier, and the right includes the diagonal of K. Both are on the log-mean scale. No uncertainty bands are shown.
The points are predicted group scales, not observed response SDs or
realised random intercepts. The right panel rises partly because this
synthetic K has larger diagonal entries at larger
z. Reading that panel alone would mix the fitted SD trend
with the matrix scale.
The optional Julia interface and prediction quantities
The matched Gamma call uses the same formula, data and raw matrix. It
uses maximum likelihood with a structured Laplace approximation. It
needs a working Julia engine setup; this
optional chunk is not run when building the article. Structured Julia
fits currently require the default control, so the native
se = FALSE setting is not copied across.
fit_gamma_julia <- drmTMB(
  gamma_formula, family = stats::Gamma(link = "log"), data = gamma_data,
  engine = "julia", REML = FALSE
)
coef(fit_gamma_julia, dpar = "sd_relmat(id)")
predict(fit_gamma_julia, dpar = "sd_relmat(id)")
The native and Julia Gamma fits have been checked against an independent Laplace objective on this data set. That comparison concerns this model and these point estimates. For ordinary Bernoulli and Poisson random intercepts, the Julia SD routes instead use adaptive Gauss-Hermite quadrature. A shared maximum-likelihood target does not make different integration approximations identical, so do not assume that all engine coefficients or log likelihoods will match.
In the R bridge, stored-row mean predictions on this Gamma route
include the fitted group effects. Supplying newdata
requests the fixed-effect prediction with random effects set to zero,
including when the supplied rows happen to be the training data.
conditional_log_mean <- predict(fit_gamma_julia, dpar = "mu", type = "link")
conditional_mean <- predict(fit_gamma_julia, dpar = "mu")
fixed_effect_mean <- predict(
  fit_gamma_julia, newdata = gamma_data, dpar = "mu"
)
all.equal(conditional_mean, fitted(fit_gamma_julia))| Quantity | Interpretation |
|---|---|
sd_relmat(id) response prediction |
The latent SD multiplier s_g; multiply by
sqrt(K_gg) for marginal group-effect SD. |
Stored R bridge mu link prediction |
The fixed linear predictor plus the fitted group contribution. |
Stored R bridge mu response
prediction |
The conditional mean, obtained by applying the inverse link to that predictor. |
R bridge mu prediction with explicit
newdata
|
The fixed-effect mean with random effects set to zero. |
Direct Julia fitted()
|
The direct interface’s population-level fitted value, which differs from the R bridge’s conditional output. |
Setting random effects to zero does not integrate over their
distribution. Under a log link, the average of exp(eta + b)
generally differs from exp(eta). State which quantity a
prediction plot shows.
Which source routes do these examples use?
The table below records narrowly admitted source routes for complete observed responses and fixed, finite, group-constant SD predictors. Source admission means that the interface accepts the specified model; it does not establish runtime accuracy, prediction support or calibrated uncertainty for every model with that description. The executed examples and their checks provide separate evidence.
| Response | Mean effect | Native source | Julia source |
|---|---|---|---|
| Bernoulli, logit | One ordinary random intercept | Admitted within recorded scope; ML; TMB random-effect Laplace | Admitted within recorded scope; ML; adaptive Gauss-Hermite quadrature, default 5 nodes |
| Poisson, log | One ordinary random intercept | Admitted within recorded scope; ML; TMB random-effect Laplace | Admitted within recorded scope; ML; adaptive Gauss-Hermite quadrature, default 41 nodes |
| Gamma, log | One relmat random intercept; raw K | Admitted within recorded scope; ML; TMB random-effect Laplace | Admitted within recorded scope; ML; structured Laplace |
Check the fit before interpreting it
The compact tables above show every check name and status without
printing long diagnostic messages. The complete objects remain available
as bernoulli_checks and poisson_checks;
inspect, for example,
bernoulli_checks[bernoulli_checks$status %in% c("warning", "error"), ]
to read full details for warning and error rows. The checks cover
optimizer, gradient, Hessian, standard-error, and random-effect boundary
diagnostics where available. Investigate any warning or error before
interpreting the coefficients. A clean diagnostic table does not
establish that the SD coefficient is well identified in every design,
and it does not assess repeated-sampling interval coverage.
These are likelihood-based fits. confint() returns
frequentist confidence intervals; it does not return Bayesian credible
intervals. This guide shows point estimates and group-level predictions
only. It makes no calibrated interval claim for these examples, so do
not report nominal confidence interval coverage as established by
running this vignette.
Scope of these examples
The executed native examples cover Bernoulli and Poisson models with one ordinary random intercept, and a Gamma model with one related-matrix random intercept. Each models the latent SD multiplier using a group-constant predictor. The optional Julia calls concern those same selected source routes, with their own fitting approximations and output contracts. These examples do not qualify other distributions, random slopes, crossed effects, missing responses or every structured provider.
Native Bernoulli/binomial also has an explicit selector form when a scalar intercept must be named:
That selector names one ordinary mean intercept. For other required models, check What can I fit today? and the formula grammar before fitting. This guide shows ML point estimates; it establishes neither calibrated interval coverage nor a REML result for these examples.