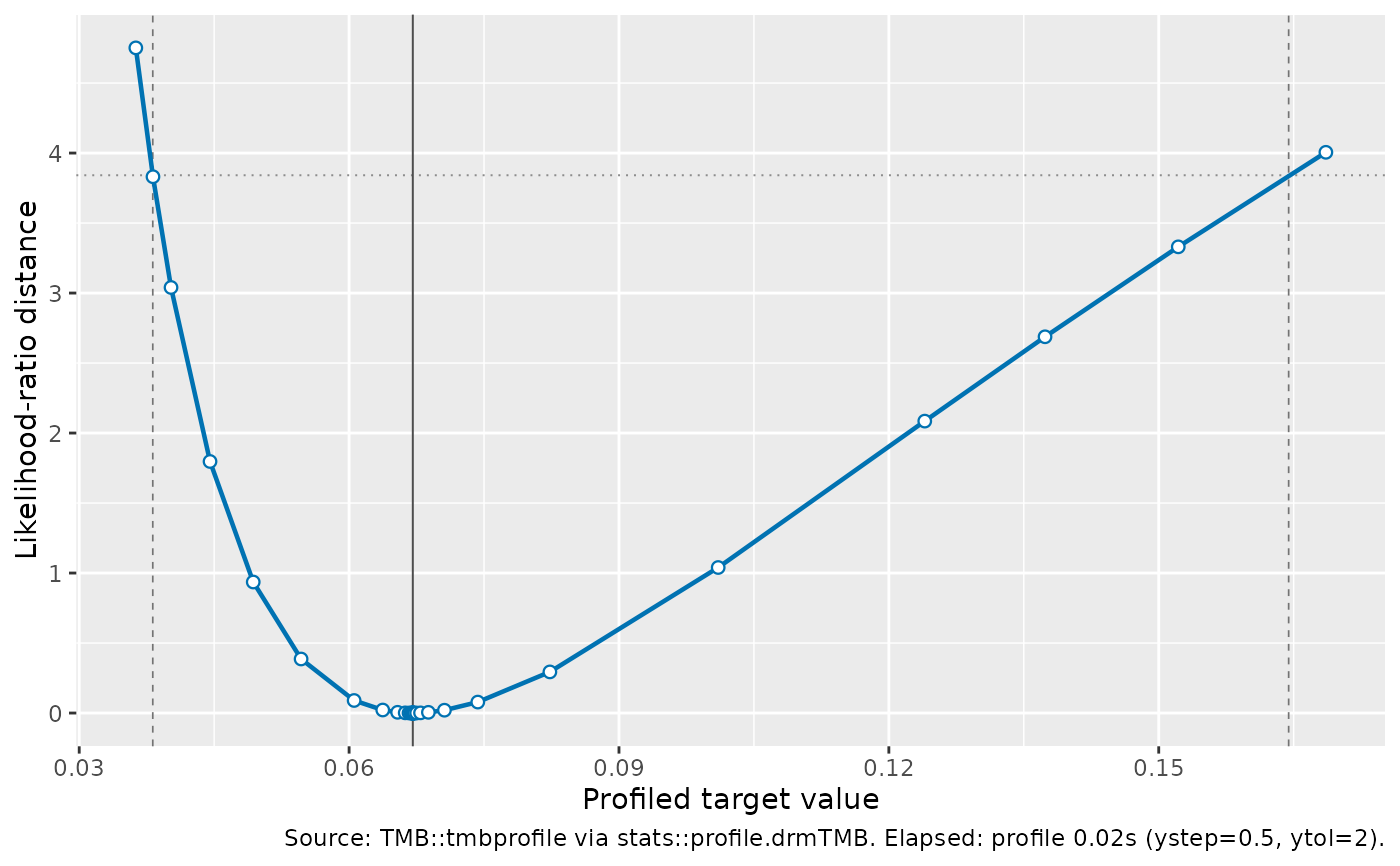
plot() for "profile.drmTMB" objects draws the likelihood-ratio curve
returned by profile.drmTMB(). The dotted horizontal line is the
likelihood-ratio cutoff for the stored confidence level, the solid vertical
line marks the fitted estimate, and dashed vertical lines mark profile
interval endpoints when they were extracted successfully. When the profile
object contains coarse and dense passes, colour and line type separate the
passes and the caption reports elapsed time for each.
Usage
# S3 method for class 'profile.drmTMB'
plot(x, interval = TRUE, ...)
Arguments
- x
A
"profile.drmTMB"object returned byprofile.drmTMB().- interval
Logical; draw profile interval endpoint lines when finite
conf.lowandconf.highcolumns are available.- ...
Reserved for future options.
Examples
dat <- data.frame(y = c(0.2, 0.5, 1.1, 1.4), x = c(-1, 0, 1, 2))
fit <- drmTMB(bf(y ~ x, sigma ~ 1), data = dat)
prof <- profile(fit, parm = "sigma", profile_precision = "fast")
if (requireNamespace("ggplot2", quietly = TRUE)) {
  plot(prof)
}