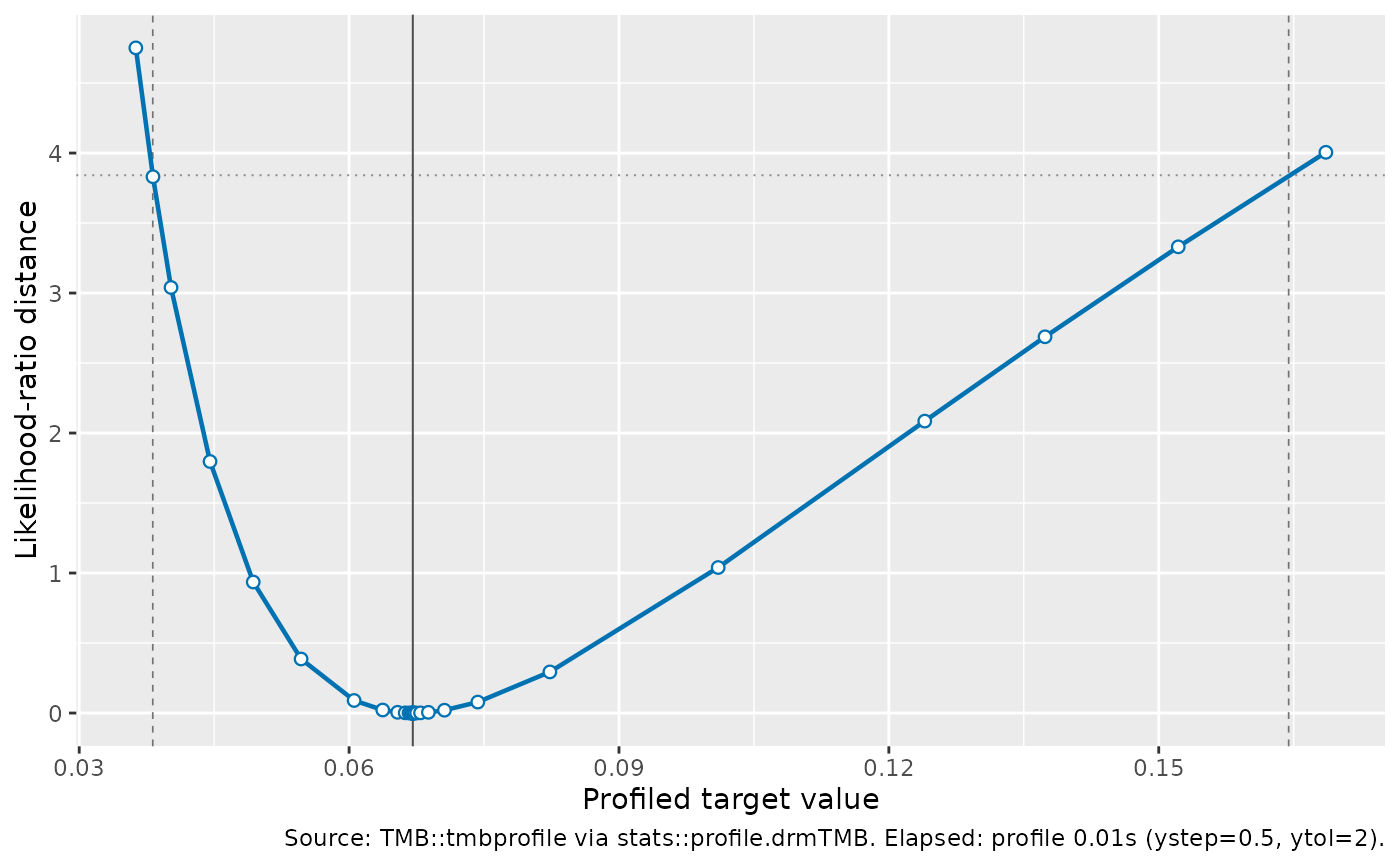
profile() computes and returns the full likelihood-profile curve for one
or more direct profile_targets(). It is a diagnostic companion to
confint.drmTMB(). Use confint.drmTMB() for interval tables, especially
with the fast endpoint engine; use profile() followed by plot() when you
need to see whether a target has a peaked, flat, one-sided, or boundary-like
likelihood shape.
Arguments
- fitted
A
drmTMBfit.- parm
Character or integer vector selecting direct profile targets. Use
profile_targets()to inspect available names. Gaussian temporal AR1 and OU fits accept mean-model coefficient targets only. Unlikeconfint.drmTMB(), this helper always uses the fullTMB::tmbprofile()curve because the curve itself is the diagnostic.- level
Confidence level used for the likelihood-ratio cutoff and interval endpoint annotations.
- trace
Logical; passed to
TMB::tmbprofile().- profile_precision
Profile-control shortcut.
"default"leavesTMB::tmbprofile()controls unchanged."fast"suppliesystep = 0.5andytol = 2unless the caller supplies those controls in....- profile_maxit
Optional positive whole number passed to
TMB::tmbprofile()asmaxit.- compare
Logical; if
TRUE, run a coarse first-pass profile and then the requested profile controls so the returned object can compare curve shape and elapsed time.- first_pass_ystep, first_pass_ytol
Coarse
TMB::tmbprofile()controls used only whencompare = TRUE. The dense pass usesprofile_precision,profile_maxit, and....- parallel
Parallel backend for profiling several targets.
"none"(the default) profiles targets one after another."multicore"profiles independent targets in forked worker processes withparallel::mclapply()on Unix-alikes;"cluster"uses socket (PSOCK) workers on any platform. The returned curves are identical to the serial result because every target starts from the same pinned optimum. A single target is always profiled serially. KeepTMB::openmp()and BLAS threads at one when using"multicore"; see drmTMB-parallel.- workers
Optional positive whole number of worker processes for
parallel = "multicore".NULLuses half the detected physical cores, capped at 10 and at the number of targets.- ...
Additional arguments passed to
TMB::tmbprofile().drmTMBsupplies the profiledobj,name,lincomb, andtracearguments internally; set the profile target withparm.
Value
A data frame with class "profile.drmTMB". The main columns are
parm, profile_value, profile_value_link, objective,
delta_objective, delta_deviance, estimate, profile_pass,
elapsed, profile_source, conf.low, conf.high, conf.status, and
profile.message.
Details
The returned x-axis values are transformed to the same scale shown by
profile_targets(). For example, SD and scale targets are shown on their
public positive scale, and correlation targets are shown on the correlation
scale. The y-axis diagnostic is likelihood-ratio distance,
2 * (profile_nll - min(profile_nll)), so a flatter curve indicates weaker
likelihood support around the fitted value.
Examples
dat <- data.frame(y = c(0.2, 0.5, 1.1, 1.4), x = c(-1, 0, 1, 2))
fit <- drmTMB(bf(y ~ x, sigma ~ 1), data = dat)
prof <- profile(fit, parm = "sigma", profile_precision = "fast")
head(prof)
#>    parm         target_class  dpar       term level profile_value
#> 1 sigma distributional-scale sigma (constant)  0.95    0.03629269
#> 2 sigma distributional-scale sigma (constant)  0.95    0.03819927
#> 3 sigma distributional-scale sigma (constant)  0.95    0.04020600
#> 4 sigma distributional-scale sigma (constant)  0.95    0.04454128
#> 5 sigma distributional-scale sigma (constant)  0.95    0.04934401
#> 6 sigma distributional-scale sigma (constant)  0.95    0.05466460
#>   profile_value_link objective delta_objective delta_deviance   estimate
#> 1          -3.316139 -2.755915       2.3756863      4.7513727 0.06708204
#> 2          -3.264939 -3.216171       1.9154307      3.8308613 0.06708204
#> 3          -3.213739 -3.611696       1.5199059      3.0398118 0.06708204
#> 4          -3.111339 -4.233141       0.8984609      1.7969219 0.06708204
#> 5          -3.008939 -4.663647       0.4679549      0.9359099 0.06708204
#> 6          -2.906539 -4.938574       0.1930279      0.3860559 0.06708204
#>   link_estimate profile_pass elapsed  profile_controls
#> 1     -2.701839      profile   0.014 ystep=0.5, ytol=2
#> 2     -2.701839      profile   0.014 ystep=0.5, ytol=2
#> 3     -2.701839      profile   0.014 ystep=0.5, ytol=2
#> 4     -2.701839      profile   0.014 ystep=0.5, ytol=2
#> 5     -2.701839      profile   0.014 ystep=0.5, ytol=2
#> 6     -2.701839      profile   0.014 ystep=0.5, ytol=2
#>                              profile_source   conf.low conf.high conf.status
#> 1 TMB::tmbprofile via stats::profile.drmTMB 0.03817676 0.1644424     profile
#> 2 TMB::tmbprofile via stats::profile.drmTMB 0.03817676 0.1644424     profile
#> 3 TMB::tmbprofile via stats::profile.drmTMB 0.03817676 0.1644424     profile
#> 4 TMB::tmbprofile via stats::profile.drmTMB 0.03817676 0.1644424     profile
#> 5 TMB::tmbprofile via stats::profile.drmTMB 0.03817676 0.1644424     profile
#> 6 TMB::tmbprofile via stats::profile.drmTMB 0.03817676 0.1644424     profile
#>   profile.message    scale transformation tmb_parameter index
#> 1              ok response            exp    beta_sigma     1
#> 2              ok response            exp    beta_sigma     1
#> 3              ok response            exp    beta_sigma     1
#> 4              ok response            exp    beta_sigma     1
#> 5              ok response            exp    beta_sigma     1
#> 6              ok response            exp    beta_sigma     1
if (requireNamespace("ggplot2", quietly = TRUE)) {
  plot(prof)
}