
Visualizing an animal model
Source:vignettes/articles/visualizing-models.Rmd
visualizing-models.RmdUse this page after fitting and before extracting a result for a paper. The current-limits page decides what may be reported; a plot or a converged optimizer does not broaden that permission.
hsquared ships a small ggplot2
visualization layer in the style of the
brms/bayesplot ecosystem (and consistent with
the sister packages drmTMB and gllvmTMB).
Every figure is produced by an autoplot() method, returns a
ggplot object you can theme and extend, and is
uncertainty-first: where the fit carries the
experimental standard errors, reliabilities, or prediction error
variances, the figure shows them — clearly labelled experimental and
asymptotic.
In your own analysis, fit is the object returned by
hsquared():
fit <- hsquared(
  weight ~ sex + animal(1 | id, pedigree = ped),
  data = dat, family = gaussian(), REML = TRUE
)
autoplot(fit, "variance")
Check the fit before plotting
Start with the exported diagnostic table. It reports the current fit payload; it does not refit, validate a route, or turn a converged optimizer into broader reporting permission. Read any convergence or boundary indication before extracting a number, then return to current limits for the route-specific reporting scope.
fit_diagnostics(fit)The figures below are rendered from small illustrative fit
objects so the article is self-contained (no engine required to
build the page); the autoplot() calls are exactly what you
would run on a real fit.
Variance components and heritability
autoplot(fit, "variance") draws a horizontal forest of
the variance components and per-trait h², with experimental
asymptotic intervals (± 1.96 · SE) when the fit carries
standard errors. These are not coverage-calibrated 95%
CIs.
autoplot(fit, "variance")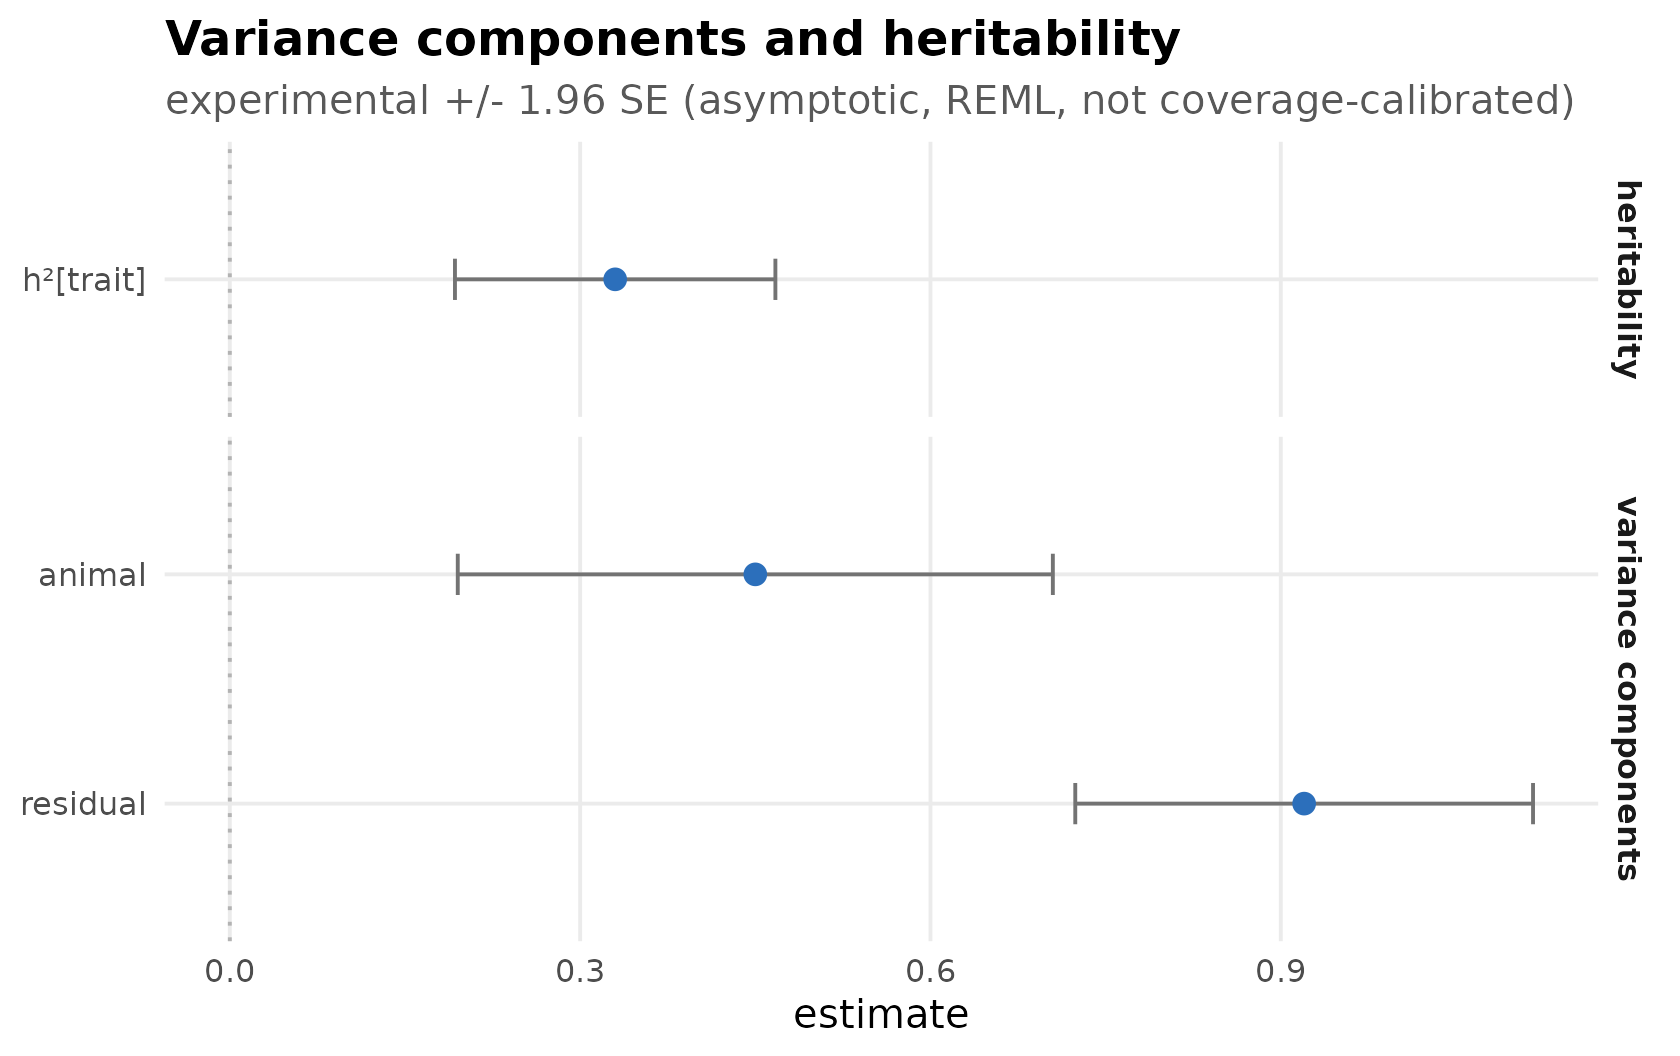
Illustrative data. Horizontal forest of animal and residual variance and heritability with experimental asymptotic error bars, labelled not coverage-calibrated.
Breeding values
autoplot(fit, "breeding_values") draws the sorted
estimated breeding values as a caterpillar, with
± 1.96 · √PEV bands when prediction error variances are
available (faceted by trait for multivariate fits). Caption: MME/PEV at
fitted variances — not a sampling distribution of h².
autoplot(fit, "breeding_values")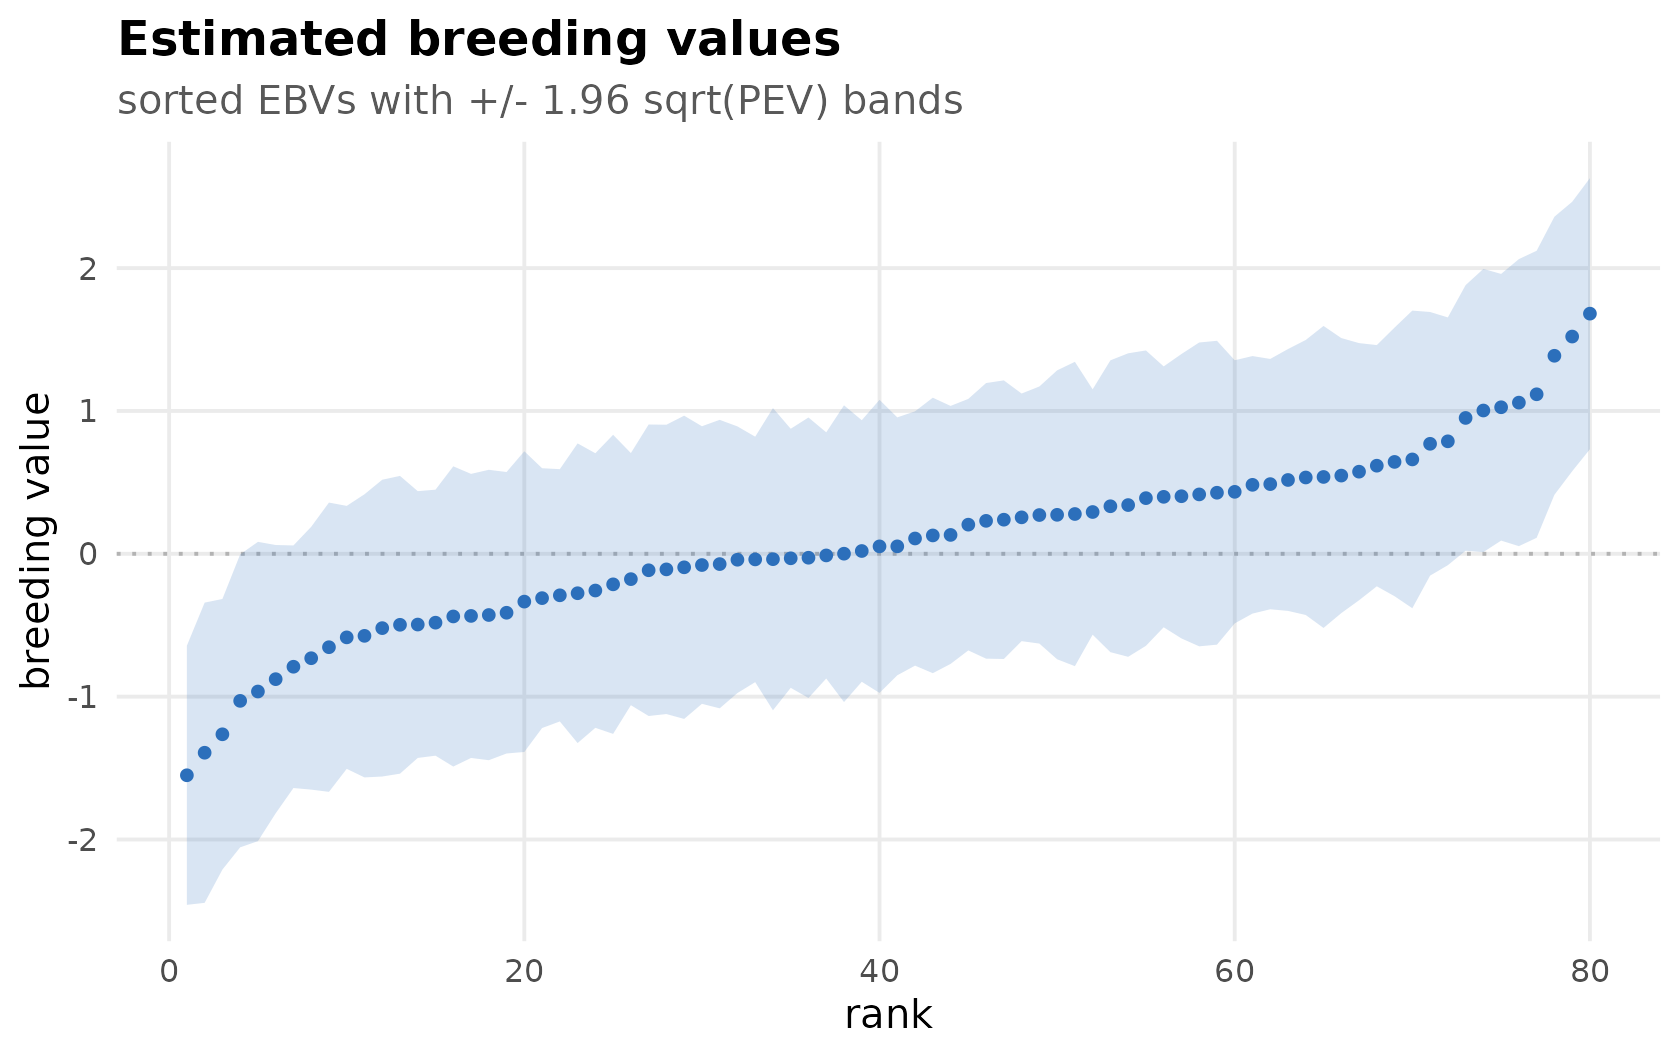
Illustrative data. Sorted EBVs with PEV bands — prediction-error grain, not a heritability CI.
Genetic correlation (G)
autoplot(fit, "g_matrix") draws the genetic-correlation
matrix of an opt-in multivariate fit. It is
rotation-invariant — correlations do not depend on the
factor rotation — so it is well defined for any multivariate fit; raw
factor loadings are never plotted (the ratified cross-lane
convention).
autoplot(fit_mv, "g_matrix")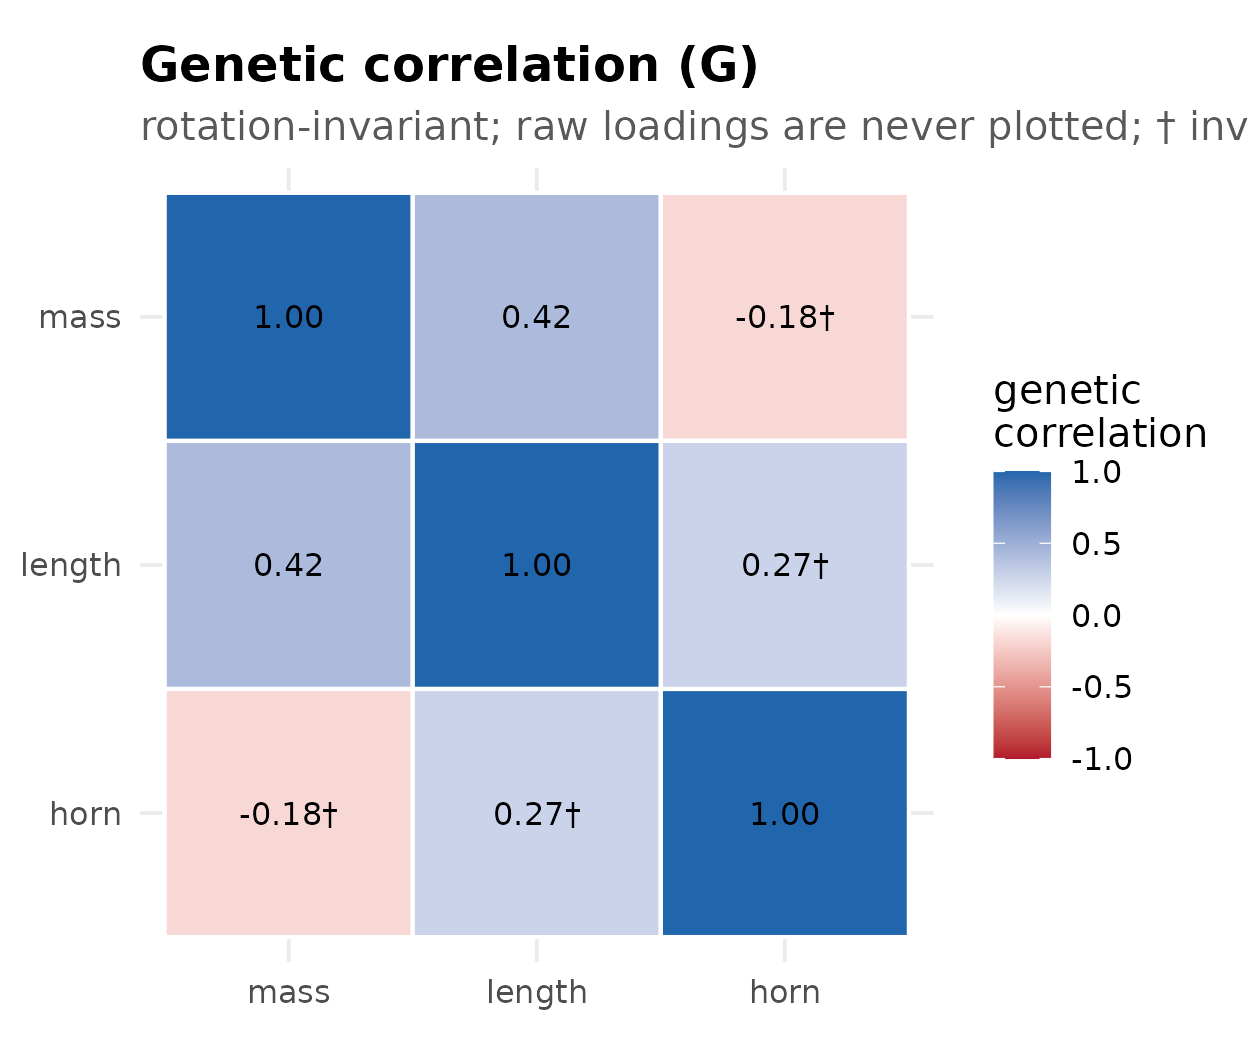
Illustrative data. Experimental / opt-in multivariate genetic-correlation triangle; rotation-invariant, loadings not shown; low-h² cells flagged imprecise.
The heatmap also flags off-diagonal cells that involve a
low-h² trait (where the genetic correlation is imprecise);
pass low_h2 = to set the threshold.
Genetic eigenstructure (G geometry)
autoplot(fit_mv, "g_geometry") draws a scree of the
rotation-invariant genetic eigenstructure — the
eigenvalues of G (variance per genetic axis) with the
percent variance explained. Axis directions and loadings are never
drawn: they are rotation-arbitrary and span-ambiguous under repeated
eigenvalues.
autoplot(fit_mv, "g_geometry")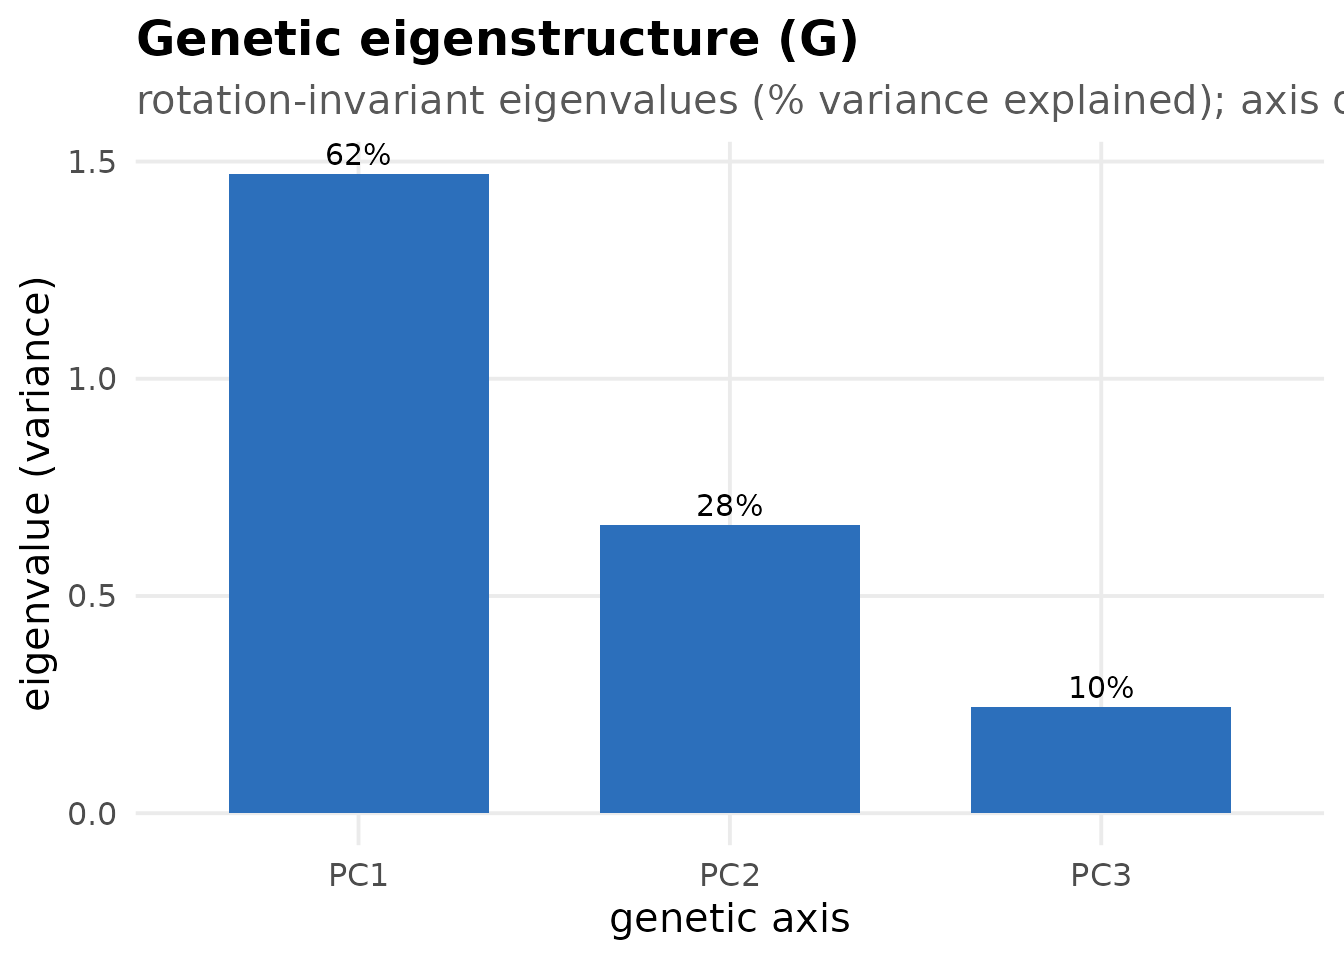
Marker scan (Manhattan)
autoplot() on the result of
gwas(fit, markers) draws a Manhattan plot. The p-values are
nominal Wald p-values and are not genome-wide
calibrated — the figure carries that banner, and the dashed
line is a plain Bonferroni reference, not a validated genome-wide
threshold. HSquared.jl PR #134 adds a fixed-panel calibration smoke
harness on the engine side, but this plot still does not carry an
activated R significance threshold.
autoplot(gw)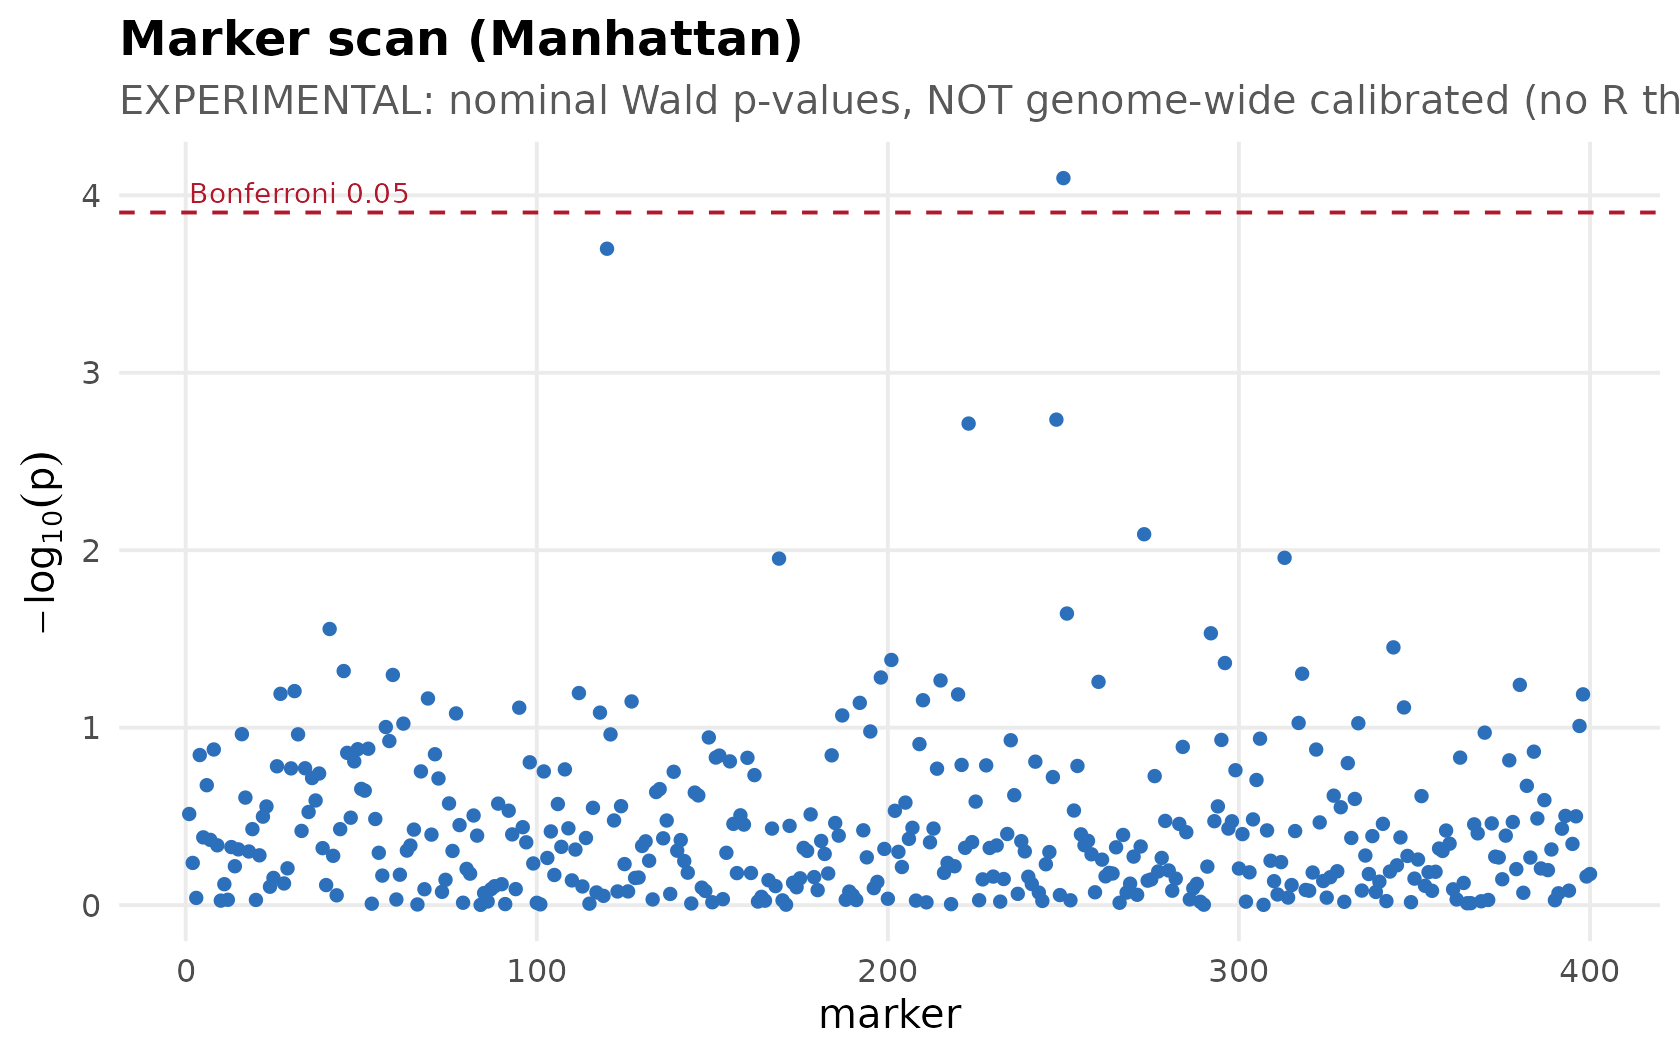
Illustrative data. Manhattan of nominal Wald p-values; dashed Bonferroni is a reference, not a validated genome-wide threshold.
Marker scan (QQ)
autoplot(gw, "qq") draws the QQ plot of the scan:
observed versus expected −log10(p) with a
y = x null reference and the genomic-inflation
lambda_GC as a diagnostic annotation. As
with the Manhattan, the p-values are nominal Wald p-values and are not
genome-wide calibrated.
autoplot(gw, "qq")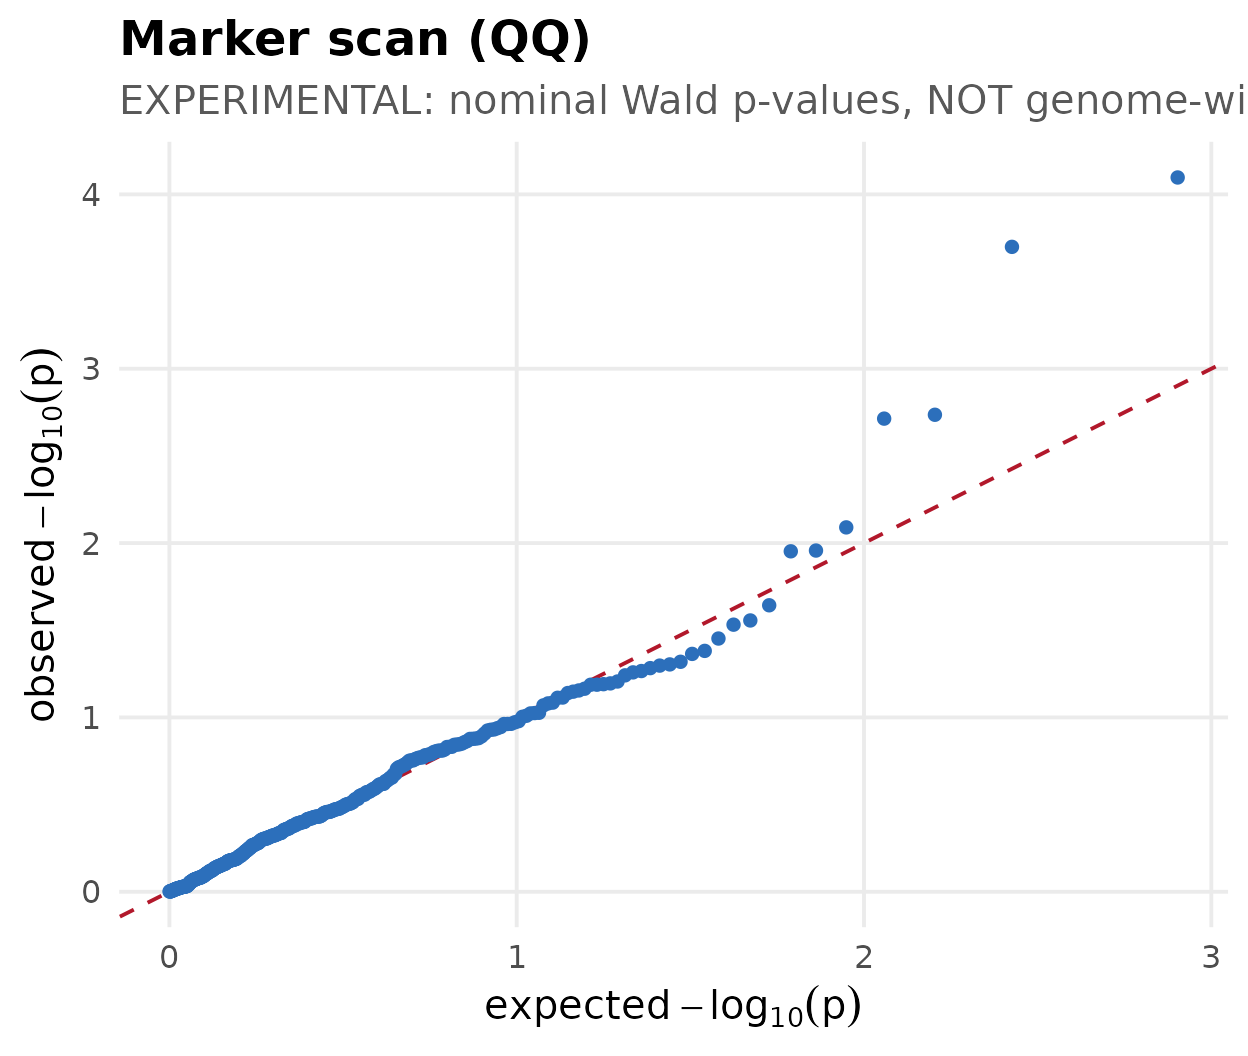
Illustrative data. QQ plot of nominal Wald p-values; not genome-wide calibrated.
Reaction norms (random regression)
For a random-regression fit,
autoplot(fit, "reaction_norm") draws the genetic-variance
and heritability trajectories across the covariate. The
h²(t) trajectory is experimental: with a homogeneous
residual and no permanent-environment term it can overstate heritability
for repeated-records designs.
autoplot(fit_rr, "reaction_norm")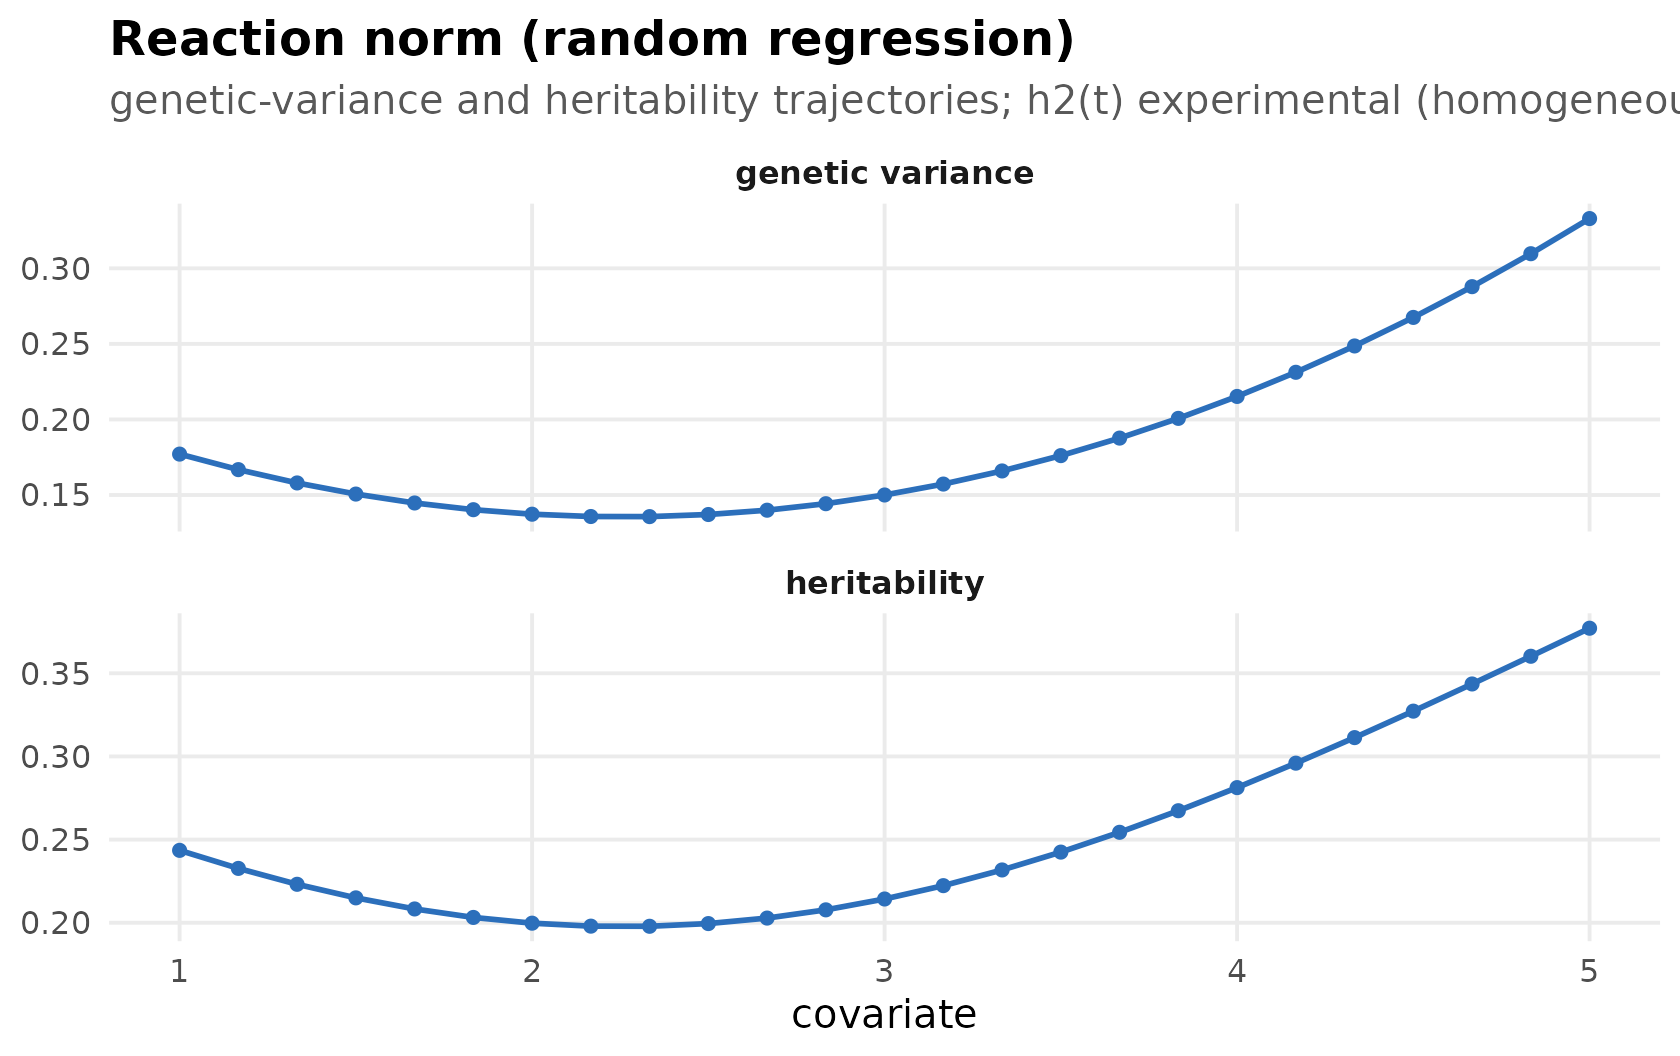
autoplot(fit, "rr_eigenfunctions") draws the
rotation-invariant eigenfunctions ψ_j(t) of the coefficient
covariance K_g as covariate functions, faceted by axis and
labelled with the percent genetic variance. Eigenfunction signs are
arbitrary and the curves are span-ambiguous under repeated eigenvalues,
so do not over-read their direction.
autoplot(fit_rr, "rr_eigenfunctions")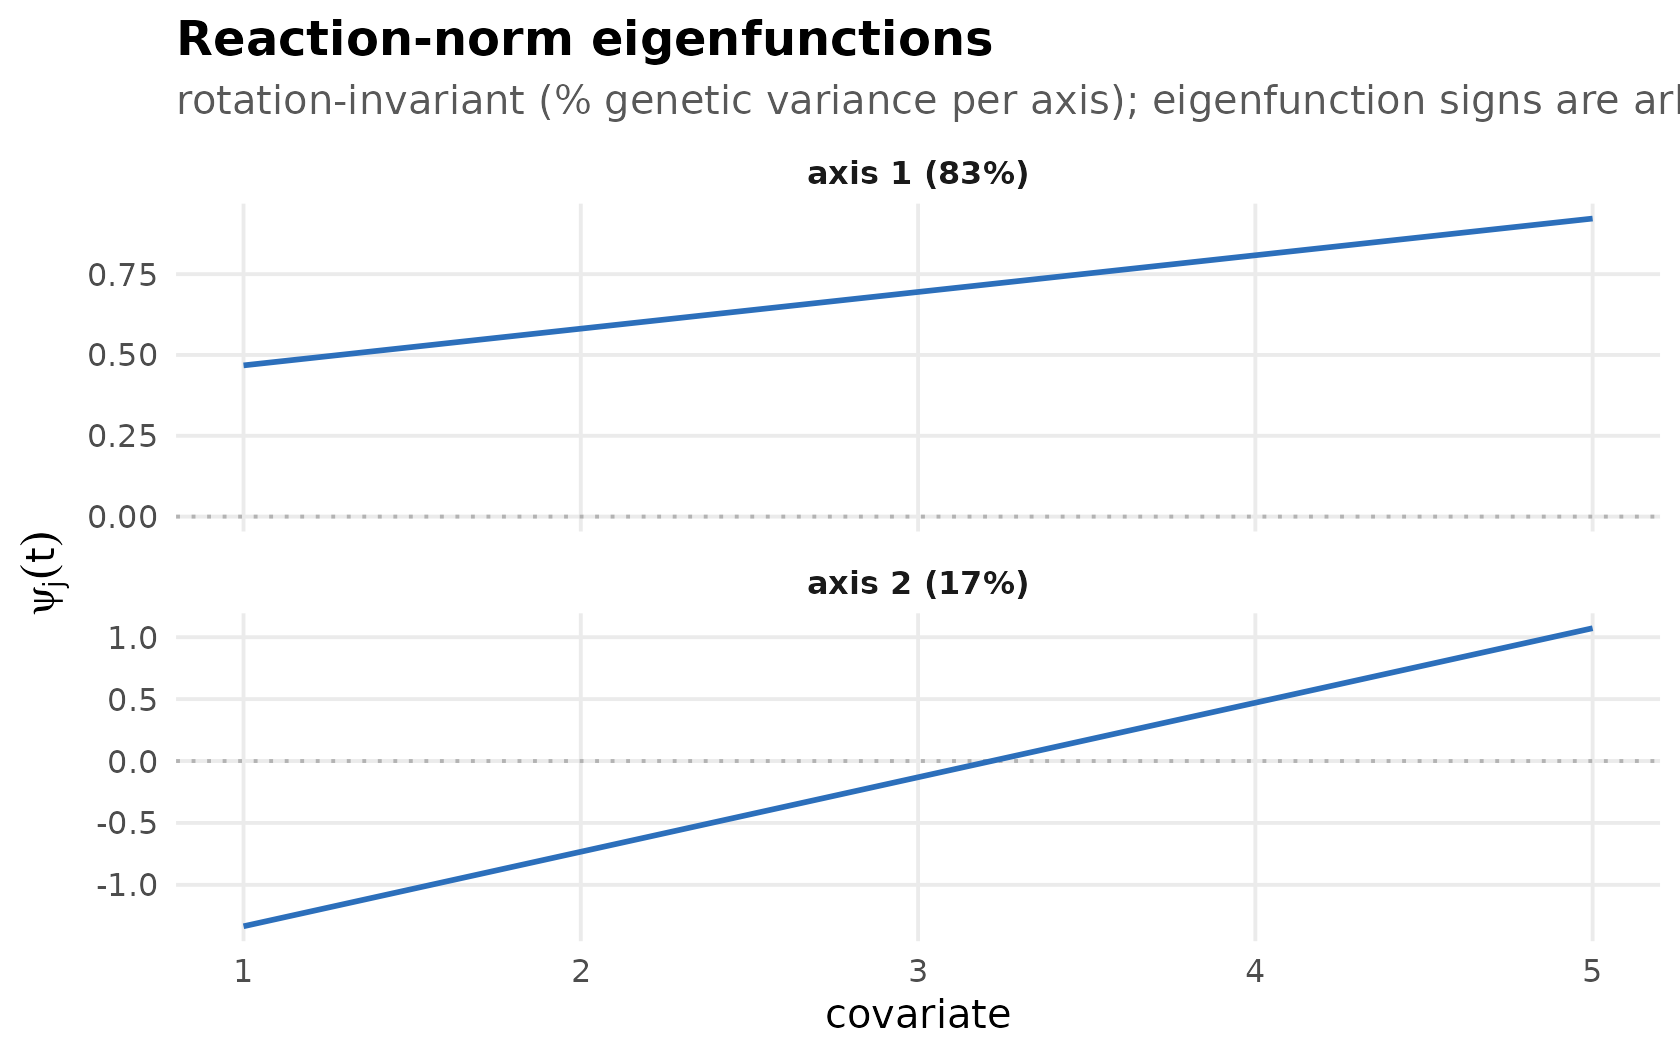
autoplot(fit, "rr_surface") draws the genetic covariance
surface S(s, t) = φ(s)′ K_g φ(t) over the covariate grid as
a heatmap; pass correlation = TRUE for the
genetic-correlation surface.
autoplot(fit_rr, "rr_surface")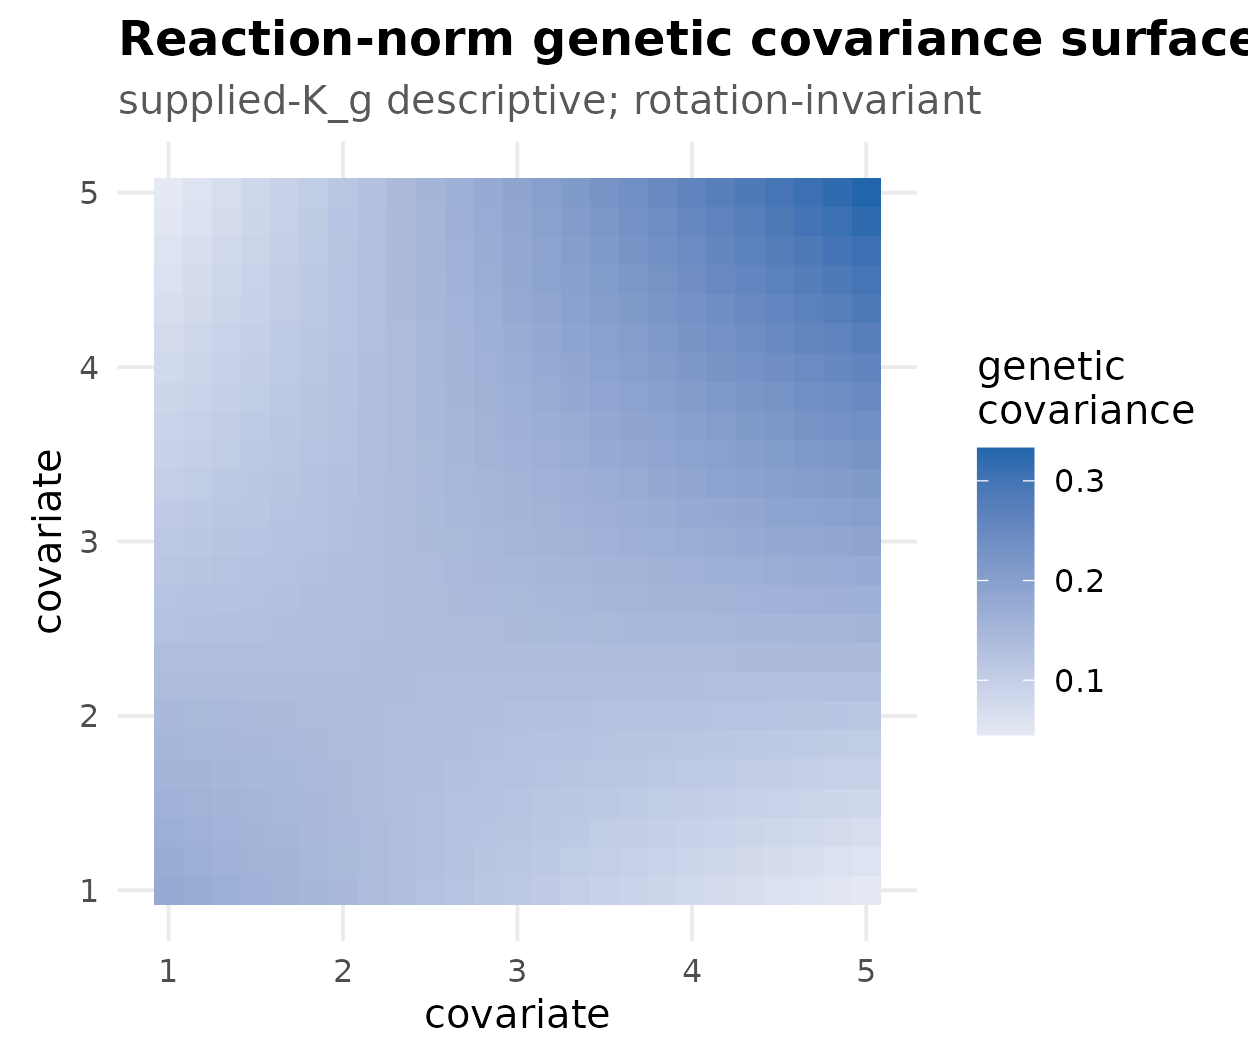
Known-truth recovery studies
hs_recovery_forest() visualizes a known-truth recovery
study (such as data-raw/multivariate-recovery-study.R):
each target’s bias with its ± 2 · MCSE interval. Intervals
that cover zero indicate no detectable bias.
recovery <- data.frame(
  target = c("G0[1,1]", "G0[2,1]", "G0[2,2]", "R0[1,1]", "R0[2,1]",
             "R0[2,2]", "rg", "h2[1]", "h2[2]"),
  bias = c(-0.00395, 0.00621, -0.01459, 0.01171, -0.01223, -0.00106,
           0.01652, -0.00756, -0.00676),
  mcse = c(0.02221, 0.01397, 0.01726, 0.01387, 0.01164, 0.01199,
           0.01553, 0.00817, 0.00697)
)
hs_recovery_forest(recovery)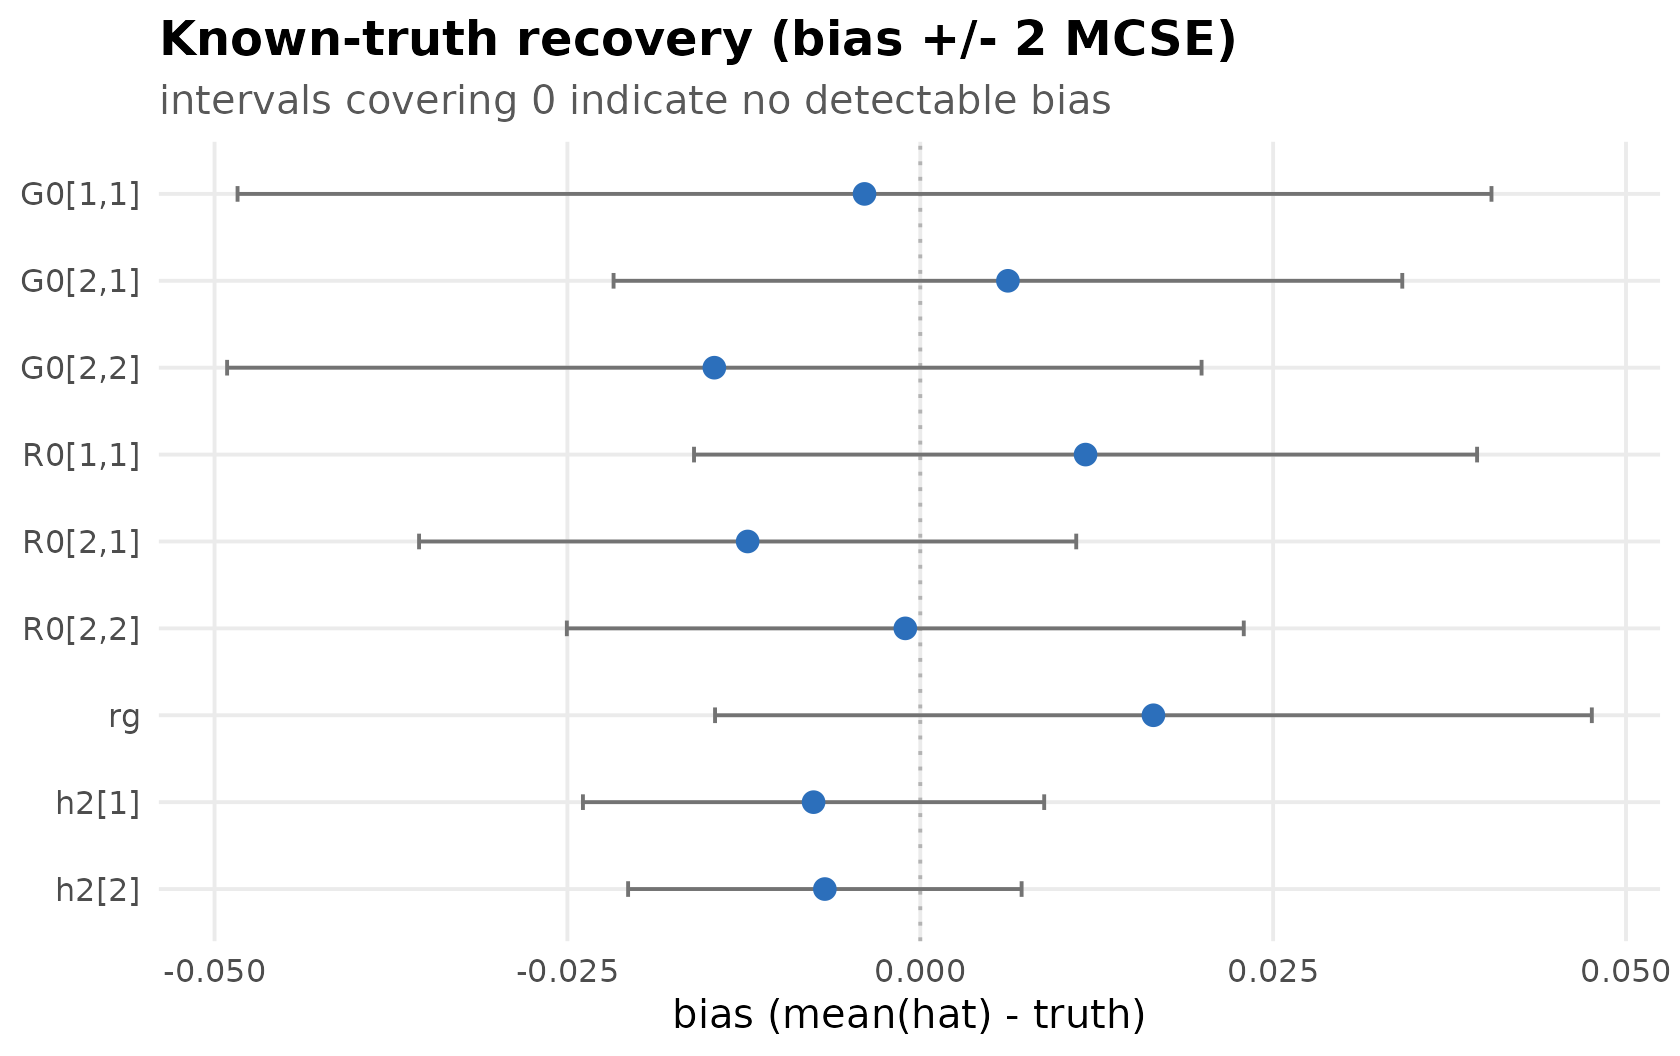
Theming
Every figure returns a ggplot object, so you can restyle
it with the usual ggplot2 grammar, and
theme_hsquared() is exported for reuse:
autoplot(fit, "variance") +
  ggplot2::labs(title = "My trait") +
  theme_hsquared(base_size = 14)