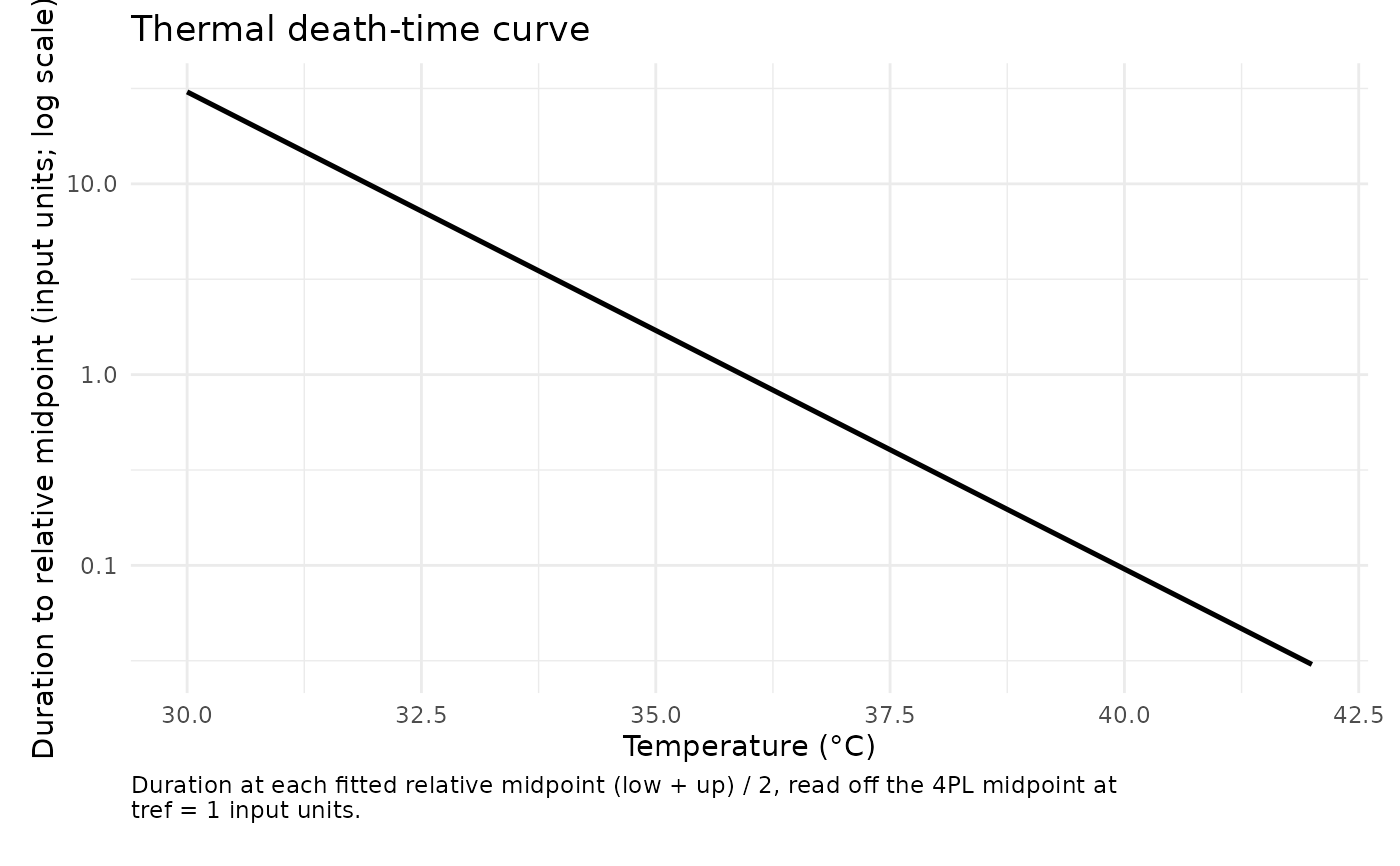
Plot the thermal death-time (TDT) curve: survival-threshold time vs temperature
Source:R/plotting.R
plot_tdt_curve.Rdplot_tdt_curve() draws the duration at which survival crosses a target
probability p against
temperature – the classic thermal-death-time line, here read directly off the
fitted 4PL via derive_lt(). With the default p = NULL, each line uses its
fitted relative midpoint (low + up) / 2, not necessarily absolute 50%
survival. Supply a numeric p for an absolute survival threshold. Time is
shown on a log10 axis. For a grouped fit a line is drawn per group.
Arguments
- fit
A
profile_tlsfit fromfit_tls().- p
NULL(default) for the fitted relative midpoint, or an absolute target survival probability in(0, 1).- temps
Numeric vector of temperatures. Defaults to a sequence over the observed temperature range.
- ...
Reserved; must be empty.
Examples
d <- simulate_tls(family = "binomial", CTmax = 36, z = 4, seed = 1)
fit <- fit_tls(d, y = survived, n = total, time = duration, temp = temp,
               family = "binomial", tref = 60)
plot_tdt_curve(fit)