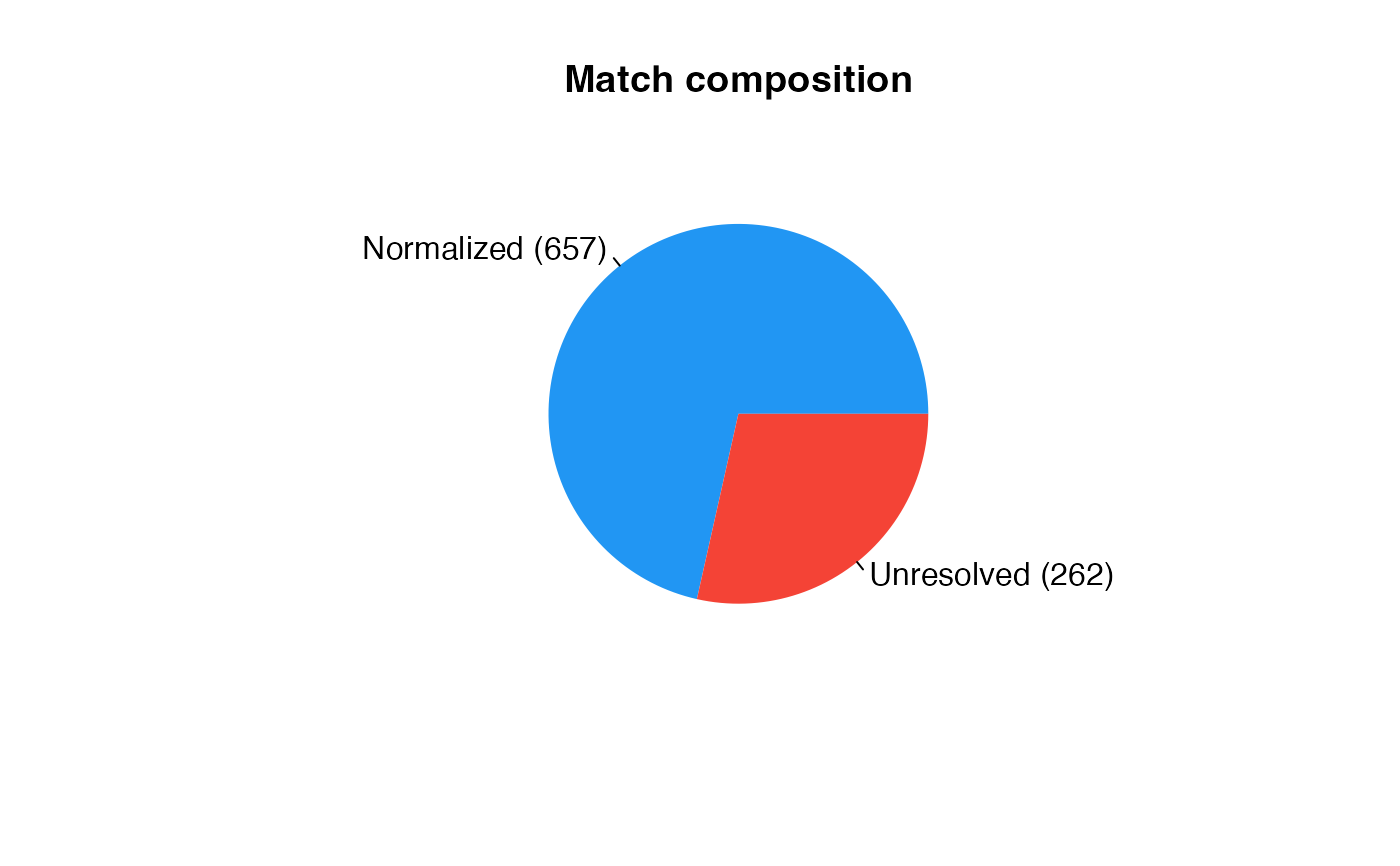
Draw a one-glance bar or pie chart of how species names were resolved (exact, normalised, synonym, fuzzy, flagged, manual, unresolved). Uses base R graphics only, so no additional packages are required.
Usage
reconcile_plot(reconciliation, type = c("bar", "pie"), ...)Arguments
- reconciliation
A reconciliation object returned by
reconcile_tree(),reconcile_data(), or a related matcher.- type
A length-1 character vector. Plot style:
"bar"(default)Horizontal stacked bar chart. Best for slides, reports, and scripting.
"pie"Pie chart. Useful when the match types are roughly balanced.
- ...
Additional arguments passed on to
graphics::barplot()orgraphics::pie()(e.g.main,col,border).
See also
reconcile_summary() for a textual breakdown;
reconcile_report() for a full HTML audit trail.
Other reconciliation functions:
reconcile_apply(),
reconcile_augment(),
reconcile_crosswalk(),
reconcile_data(),
reconcile_diff(),
reconcile_export(),
reconcile_mapping(),
reconcile_merge(),
reconcile_multi(),
reconcile_override(),
reconcile_override_batch(),
reconcile_report(),
reconcile_review(),
reconcile_splits_lumps(),
reconcile_suggest(),
reconcile_summary(),
reconcile_to_trees(),
reconcile_tree(),
reconcile_trees()
Examples
data(avonet_subset)
data(tree_jetz)
rec <- reconcile_tree(avonet_subset, tree_jetz,
                      x_species = "Species1", authority = NULL)
#> ℹ Reconciling 919 data names vs 657 tree tips
#> ℹ Matching 919 x 657 names through 2 stages...
#> ℹ Stage 1/2: Exact matching...
#> ℹ Stage 2/2: Normalised matching (0 matched so far)...
#> ✔ Matched 657/919 data names to tree tips
reconcile_plot(rec)

reconcile_plot(rec, type = "pie")