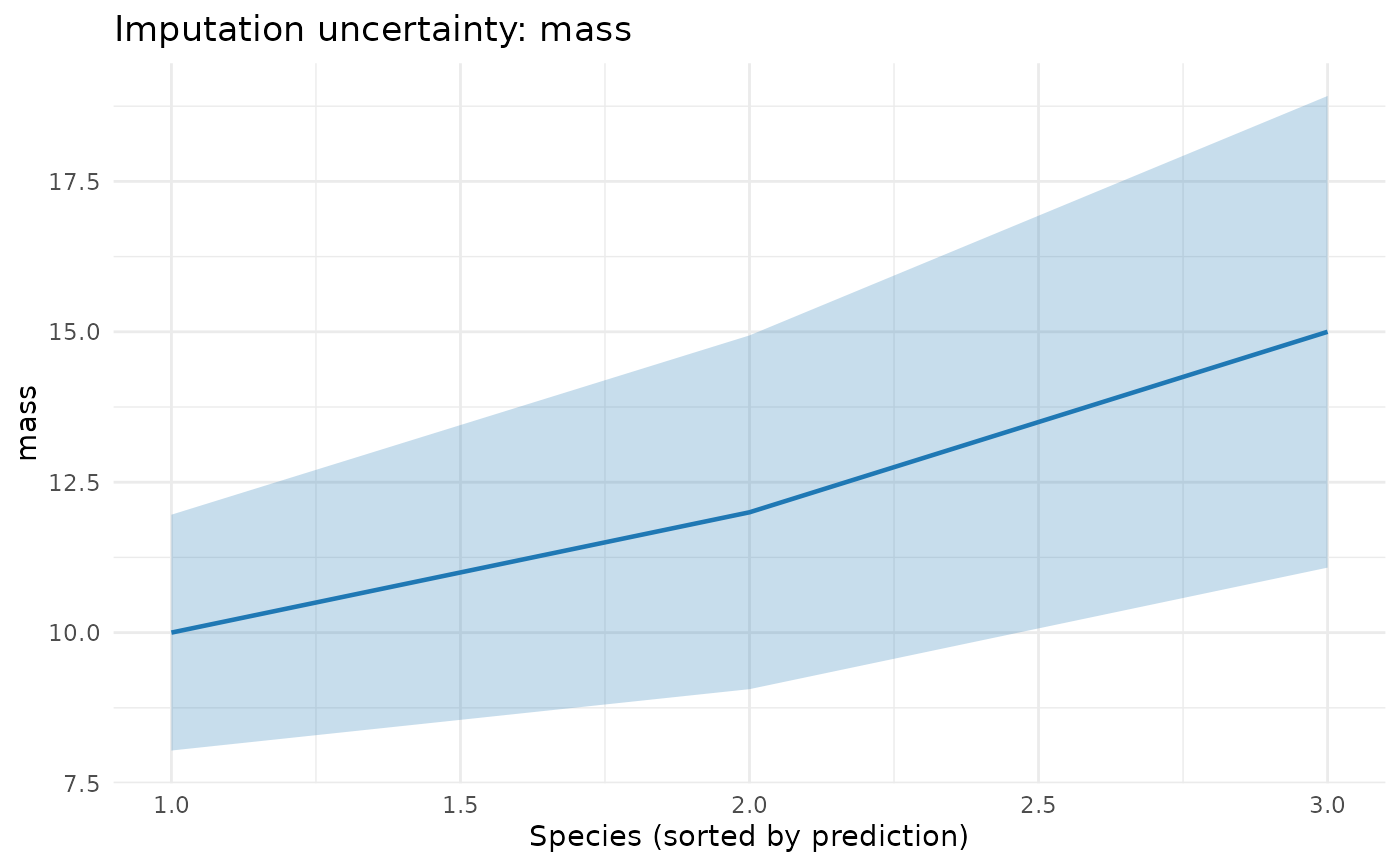
Plots conformal prediction intervals when present, otherwise an
approximate prediction +/- 1.96 * SE ribbon, sorted by predicted
value. If truth is supplied, observed values are overlaid as
points. Works for continuous, count, and ordinal traits. For binary
traits, plots predicted probabilities with an uncertainty ribbon.
Usage
plot_uncertainty(pred_result, truth = NULL, trait_name)
Arguments
- pred_result
list with imputed and se components
(output of predict.pigauto_fit).
- truth
matrix or data.frame of true values (same scale as
pred_result$imputed), or NULL.
- trait_name
character. Which trait to plot (must match column name).
Examples
pred <- list(
  imputed = data.frame(mass = c(10, 12, 15)),
  se = matrix(c(1, 1.5, 2), ncol = 1,
              dimnames = list(NULL, "mass"))
)
plot_uncertainty(pred, trait_name = "mass")