Deprecated. Use the base-R S3 method instead:
plot(fit, type = "history").
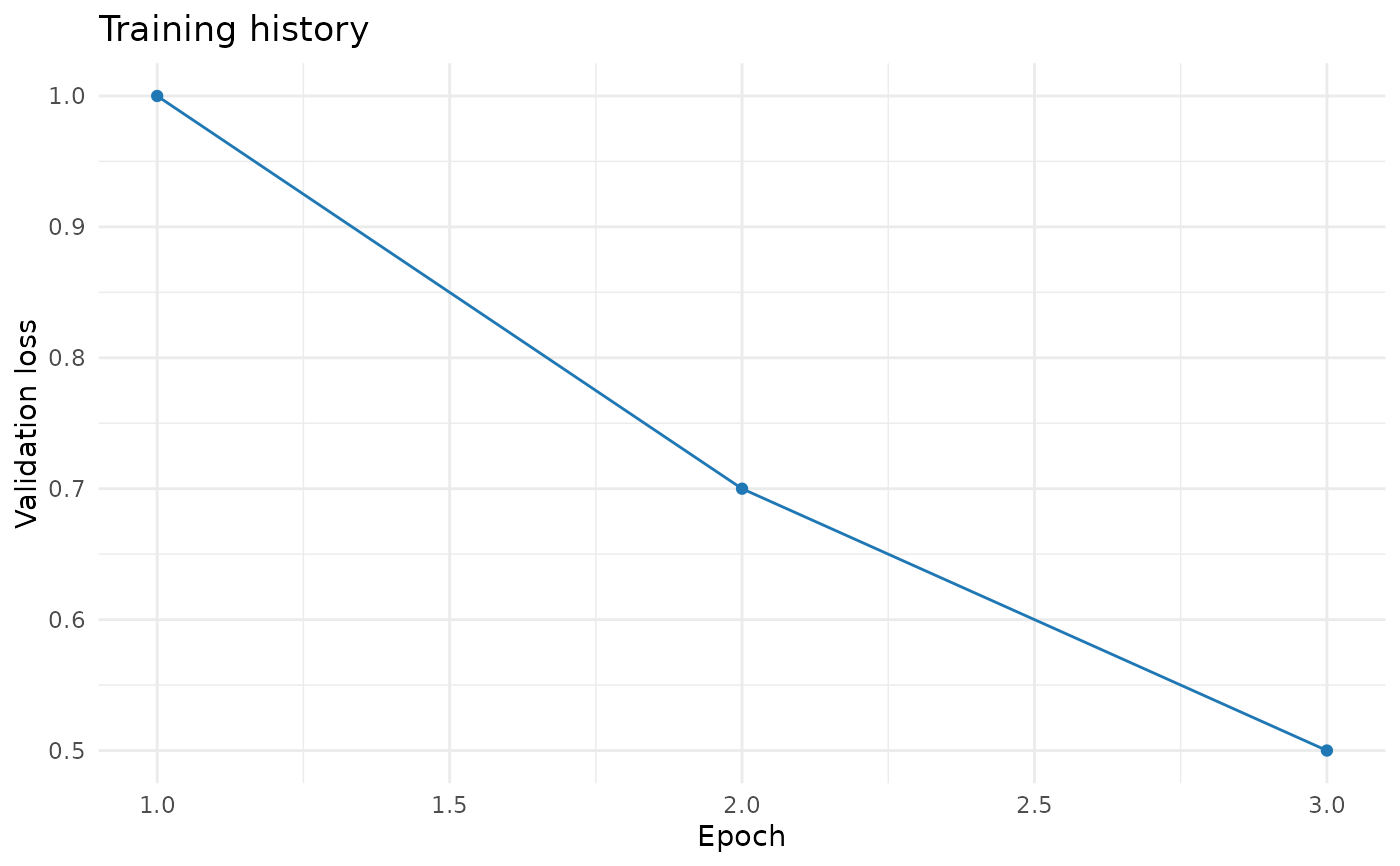
Produces a ggplot2 validation loss training curve.
Examples
fit <- structure(
  list(history = data.frame(epoch = 1:3, val_loss = c(1, 0.7, 0.5))),
  class = "pigauto_fit"
)
plot_history_gg(fit)