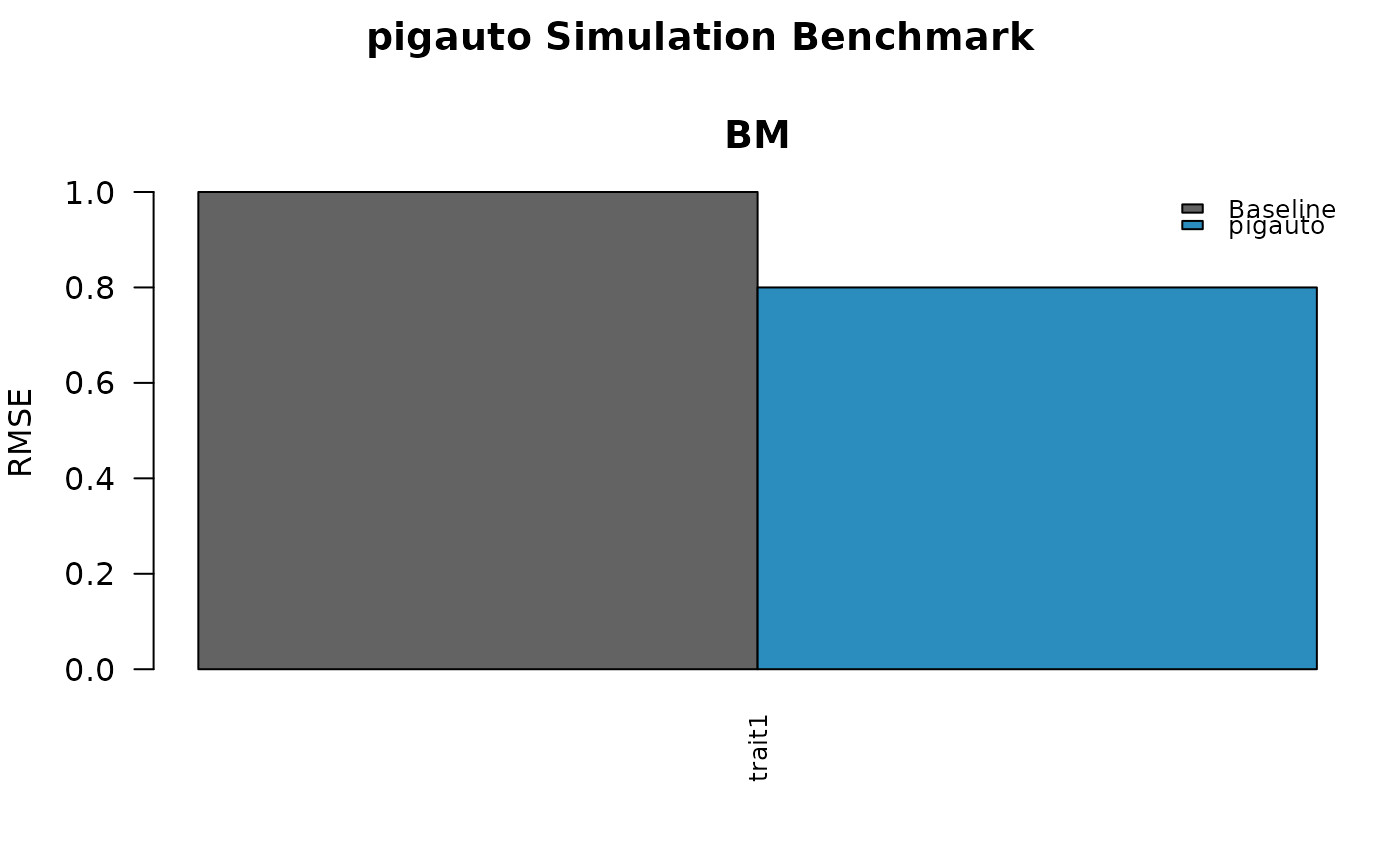
Creates a multi-panel comparison plot showing BM baseline vs pigauto performance across all simulation scenarios.
Usage
# S3 method for class 'pigauto_benchmark'
plot(x, metric = "rmse", ...)Creates a multi-panel comparison plot showing BM baseline vs pigauto performance across all simulation scenarios.
# S3 method for class 'pigauto_benchmark'
plot(x, metric = "rmse", ...)